
 Yahoo Finance
 James Hardie Industries plc's (ASX:JHX) Fundamentals Look Pretty Strong: Could The Market Be Wrong About The Stock?
James Hardie Industries (ASX:JHX) has had a rough three months with its share price down 24%. However, stock prices are usually driven by a company’s financial performance over the long term, which in this case looks quite promising. Specifically, we decided to study James Hardie Industries' ROE in this article.
Return on equity or ROE is a key measure used to assess how efficiently a company's management is utilizing the company's capital. In short, ROE shows the profit each dollar generates with respect to its shareholder investments.
See our latest analysis for James Hardie Industries
How To Calculate Return On Equity?
Return on equity can be calculated by using the formula:
Return on Equity = Net Profit (from continuing operations) ÷ Shareholders' Equity
So, based on the above formula, the ROE for James Hardie Industries is:
34% = US$459m ÷ US$1.3b (Based on the trailing twelve months to March 2022).
The 'return' refers to a company's earnings over the last year. That means that for every A$1 worth of shareholders' equity, the company generated A$0.34 in profit.
What Is The Relationship Between ROE And Earnings Growth?
We have already established that ROE serves as an efficient profit-generating gauge for a company's future earnings. We now need to evaluate how much profit the company reinvests or "retains" for future growth which then gives us an idea about the growth potential of the company. Generally speaking, other things being equal, firms with a high return on equity and profit retention, have a higher growth rate than firms that don’t share these attributes.
James Hardie Industries' Earnings Growth And 34% ROE
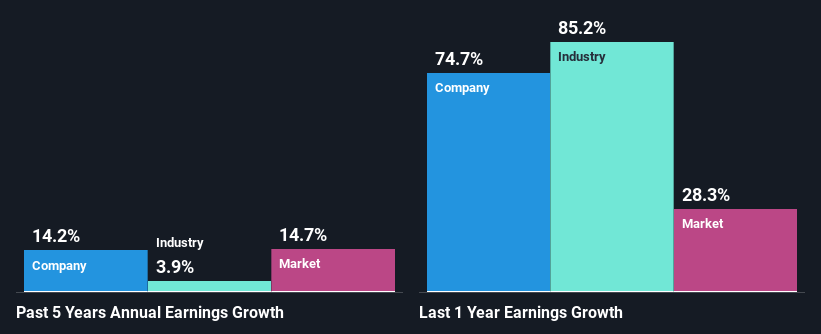
To begin with, James Hardie Industries has a pretty high ROE which is interesting. Additionally, the company's ROE is higher compared to the industry average of 25% which is quite remarkable. This likely paved the way for the modest 14% net income growth seen by James Hardie Industries over the past five years. growth
As a next step, we compared James Hardie Industries' net income growth with the industry, and pleasingly, we found that the growth seen by the company is higher than the average industry growth of 3.9%.
Earnings growth is an important metric to consider when valuing a stock. The investor should try to establish if the expected growth or decline in earnings, whichever the case may be, is priced in. By doing so, they will have an idea if the stock is headed into clear blue waters or if swampy waters await. One good indicator of expected earnings growth is the P/E ratio which determines the price the market is willing to pay for a stock based on its earnings prospects. So, you may want to check if James Hardie Industries is trading on a high P/E or a low P/E, relative to its industry.
Is James Hardie Industries Efficiently Re-investing Its Profits?
James Hardie Industries has a three-year median payout ratio of 41%, which implies that it retains the remaining 59% of its profits. This suggests that its dividend is well covered, and given the decent growth seen by the company, it looks like management is reinvesting its earnings efficiently.
Additionally, James Hardie Industries has paid dividends over a period of at least ten years which means that the company is pretty serious about sharing its profits with shareholders. Looking at the current analyst consensus data, we can see that the company's future payout ratio is expected to rise to 52% over the next three years. Regardless, the ROE is not expected to change much for the company despite the higher expected payout ratio.
Summary
On the whole, we feel that James Hardie Industries' performance has been quite good. In particular, it's great to see that the company is investing heavily into its business and along with a high rate of return, that has resulted in a sizeable growth in its earnings. We also studied the latest analyst forecasts and found that the company's earnings growth is expected be similar to its current growth rate. To know more about the company's future earnings growth forecasts take a look at this free report on analyst forecasts for the company to find out more.
Have feedback on this article? Concerned about the content? Get in touch with us directly. Alternatively, email editorial-team (at) simplywallst.com.
This article by Simply Wall St is general in nature. We provide commentary based on historical data and analyst forecasts only using an unbiased methodology and our articles are not intended to be financial advice. It does not constitute a recommendation to buy or sell any stock, and does not take account of your objectives, or your financial situation. We aim to bring you long-term focused analysis driven by fundamental data. Note that our analysis may not factor in the latest price-sensitive company announcements or qualitative material. Simply Wall St has no position in any stocks mentioned.
