
 Yahoo Finance
 Are Kaman Corporation's (NYSE:KAMN) Mixed Financials The Reason For Its Gloomy Performance on The Stock Market?
It is hard to get excited after looking at Kaman's (NYSE:KAMN) recent performance, when its stock has declined 10% over the past three months. It seems that the market might have completely ignored the positive aspects of the company's fundamentals and decided to weigh-in more on the negative aspects. Stock prices are usually driven by a company’s financial performance over the long term, and therefore we decided to pay more attention to the company's financial performance. Specifically, we decided to study Kaman's ROE in this article.
Return on equity or ROE is an important factor to be considered by a shareholder because it tells them how effectively their capital is being reinvested. Put another way, it reveals the company's success at turning shareholder investments into profits.
Check out our latest analysis for Kaman
How Is ROE Calculated?
Return on equity can be calculated by using the formula:
Return on Equity = Net Profit (from continuing operations) ÷ Shareholders' Equity
So, based on the above formula, the ROE for Kaman is:
4.1% = US$32m ÷ US$779m (Based on the trailing twelve months to July 2022).
The 'return' is the amount earned after tax over the last twelve months. That means that for every $1 worth of shareholders' equity, the company generated $0.04 in profit.
What Is The Relationship Between ROE And Earnings Growth?
Thus far, we have learned that ROE measures how efficiently a company is generating its profits. We now need to evaluate how much profit the company reinvests or "retains" for future growth which then gives us an idea about the growth potential of the company. Assuming all else is equal, companies that have both a higher return on equity and higher profit retention are usually the ones that have a higher growth rate when compared to companies that don't have the same features.
Kaman's Earnings Growth And 4.1% ROE
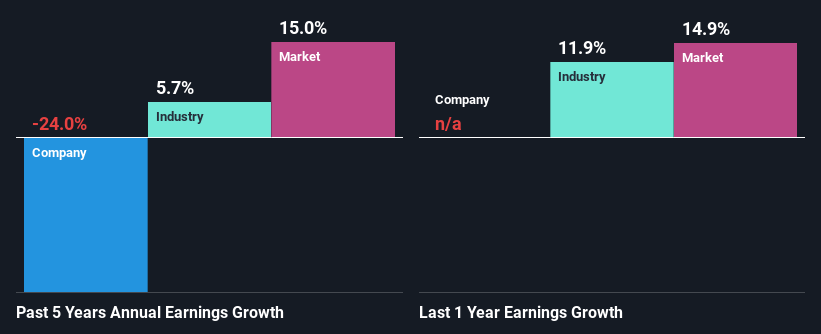
On the face of it, Kaman's ROE is not much to talk about. We then compared the company's ROE to the broader industry and were disappointed to see that the ROE is lower than the industry average of 10%. Given the circumstances, the significant decline in net income by 24% seen by Kaman over the last five years is not surprising. However, there could also be other factors causing the earnings to decline. For example, it is possible that the business has allocated capital poorly or that the company has a very high payout ratio.
However, when we compared Kaman's growth with the industry we found that while the company's earnings have been shrinking, the industry has seen an earnings growth of 5.7% in the same period. This is quite worrisome.
The basis for attaching value to a company is, to a great extent, tied to its earnings growth. It’s important for an investor to know whether the market has priced in the company's expected earnings growth (or decline). This then helps them determine if the stock is placed for a bright or bleak future. If you're wondering about Kaman's's valuation, check out this gauge of its price-to-earnings ratio, as compared to its industry.
Is Kaman Making Efficient Use Of Its Profits?
In spite of a normal three-year median payout ratio of 48% (that is, a retention ratio of 52%), the fact that Kaman's earnings have shrunk is quite puzzling. So there could be some other explanations in that regard. For instance, the company's business may be deteriorating.
Additionally, Kaman has paid dividends over a period of at least ten years, which means that the company's management is determined to pay dividends even if it means little to no earnings growth.
Summary
In total, we're a bit ambivalent about Kaman's performance. While the company does have a high rate of profit retention, its low rate of return is probably hampering its earnings growth. Having said that, looking at current analyst estimates, we found that the company's earnings growth rate is expected to see a huge improvement. To know more about the company's future earnings growth forecasts take a look at this free report on analyst forecasts for the company to find out more.
Have feedback on this article? Concerned about the content? Get in touch with us directly. Alternatively, email editorial-team (at) simplywallst.com.
This article by Simply Wall St is general in nature. We provide commentary based on historical data and analyst forecasts only using an unbiased methodology and our articles are not intended to be financial advice. It does not constitute a recommendation to buy or sell any stock, and does not take account of your objectives, or your financial situation. We aim to bring you long-term focused analysis driven by fundamental data. Note that our analysis may not factor in the latest price-sensitive company announcements or qualitative material. Simply Wall St has no position in any stocks mentioned.
Join A Paid User Research Session
You’ll receive a US$30 Amazon Gift card for 1 hour of your time while helping us build better investing tools for the individual investors like yourself. Sign up here
