
 Yahoo Finance
 KB Home (KBH) Shares Jump More Than 6% on Q3 Earnings Beat


KB Home’s KBH shares have gained more than 6% in after-hour trading yesterday on solid third-quarter fiscal 2018 results. Not only did the homebuilder’s bottom line surpass the Zacks Consensus Estimate but it also increased considerably year over year. The performance reflects a solid housing market despite rising interest rate woes.
The company’s shares have gained 17% in the past year, while its industry has declined 6.1%. The outperformance was backed by an impressive earnings surprise history, beating the consensus mark for 11 straight quarters.
Earnings & Revenue Discussion
Quarterly earnings of 87 cents per share outpaced the Zacks Consensus Estimate of 78 cents by 11.5% and increased 71% from 51 cents a year ago.
Total revenues of $1.22 billion, however, missed the consensus mark of $1.27 million. The top line improved 7.1% year over year on higher housing revenues.
Segment Details
Homebuilding Revenues: In the reported quarter, homebuilding revenues increased 7.1% to $1,221.9 million from the prior-year quarter, driven by an increase in the number of homes delivered. While land generated $2.3 million in revenues (down 33.3% from the year-ago quarter), housing revenues totaled $1,219.6 million (up 7.2%).
Net orders increased 3% to 2,685 homes, rising across the Central and Southeast regions, while net orders fell in West Coast and Southwest regions. Value of net orders, however, decreased 5% to $1.02 billion.
Number of homes delivered improved 8% from the year-ago level to 2,988 units. Deliveries increased in three regions, except West Coast. Average selling price fell a slight 0.8% to $408,200.
At the end of the reported quarter, average community count was 217, down 7% year over year.
The company’s backlog totaled 5,484 homes (as of Aug 31, 2018), up 0.5% from a year ago. Potential housing revenues from backlog decreased 4% to $2.04 billion.
Margins
Adjusted housing gross profit margin (a metric that excludes the amortization of previously capitalized interest and inventory-related charges) expanded 140 basis points (bps) year over year to 23.1%.
As a percentage of housing revenues, selling, general and administrative expenses (SG&A) were 9.4%, up 20 bps from the year-ago figure.
Homebuilding operating margin increased 190 bps on a year-over-year basis, primarily driven by continued improvement in its housing gross margin.
Financial Services revenues grew 8% year over year to $3.5 million.
Financial Position
KB Home had homebuilding cash and cash equivalents of $354.4 million as of Aug 31, 2018, lower than $720.6 million as of Nov 30, 2017. Inventories were $3.7 billion, up from $3.3 billion as of Nov 30, 2017. KB Home had total liquidity of $816.7 million at the end of the quarter.
Net cash used in operating activities was $49.5 million in the first nine months of fiscal 2018, compared with $103.3 million of net cash provided by operating activities a year ago.
The ratio of debt to capital was 50.6% (up 410 bps) as of Aug 31, 2018, while that of net debt to capital was 45.9%, which is within the company’s 2019 targeted range under its Returns-Focused Growth Plan.
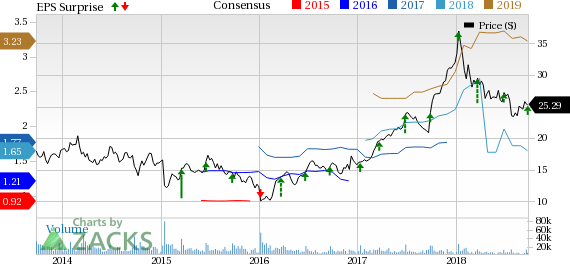
KB Home Price, Consensus and EPS Surprise
KB Home Price, Consensus and EPS Surprise | KB Home Quote
Fourth-Quarter Guidance
KB Home expects housing revenues between $1.39 billion and $1.45 billion and ASP of around $400,000-$405,000. Meanwhile, SG&A ratio is projected in the range of 8.8-9.2%. Average community count is expected to be flat with the year-ago level of 228.
The company expects housing gross margin (assuming no inventory-related charges) in the range of 18.3-18.7%.
Homebuilding operating margin (excluding impact of any inventory-related charges) is expected within 9.3-9.7%.
Fiscal 2018 Guidance Revised
KB Home now expects housing revenues of approximately $4.6 billion, which is at the low end of its previous guided range of $4.6-$4.8 billion. Average community count is now anticipated to be up 4% year over year.
The company expects housing gross margin (excluding inventory-related charges) at the high end of the earlier guided range of 17.6-18%, i.e., at 18%, reflecting an improvement of 110 bps. SG&A ratio will now likely be around 9.8% versus 8.8-9.2% expected earlier.
Homebuilding operating margin is now expected at around 8.2%, which is at the high end of the previously projected range of 7.7-8.2%.
Key Picks
Currently, KB Home carries a Zacks Rank #4 (Sell).
Some better-ranked stocks in the Zacks Construction sector are Beazer Homes USA, Inc. BZH, Century Communities, Inc. CCS and D.R. Horton, Inc. DHI, each carrying a Zacks Rank #2 (Buy). You can see the complete list of today’s Zacks #1 Rank (Strong Buy) stocks here.
Beazer Homes has an average positive earnings surprise of 169.7% for the last four quarters.
Century Communities has an average positive earnings surprise of 55.3% for the trailing four quarters.
D.R. Horton has an expected earnings per share growth rate of 41.2% for the current year.
The Hottest Tech Mega-Trend of All
Last year, it generated $8 billion in global revenues. By 2020, it's predicted to blast through the roof to $47 billion. Famed investor Mark Cuban says it will produce ""the world's first trillionaires,"" but that should still leave plenty of money for regular investors who make the right trades early.
See Zacks' 3 Best Stocks to Play This Trend >>
Want the latest recommendations from Zacks Investment Research? Today, you can download 7 Best Stocks for the Next 30 Days. Click to get this free report
Century Communities, Inc. (CCS) : Free Stock Analysis Report
D.R. Horton, Inc. (DHI) : Free Stock Analysis Report
KB Home (KBH) : Free Stock Analysis Report
Beazer Homes USA, Inc. (BZH) : Free Stock Analysis Report
To read this article on Zacks.com click here.
Zacks Investment Research
