
 Yahoo Finance
 What Kind Of Investor Owns Most Of Fortuna Silver Mines Inc. (TSE:FVI)?

Every investor in Fortuna Silver Mines Inc. (TSE:FVI) should be aware of the most powerful shareholder groups. Generally speaking, as a company grows, institutions will increase their ownership. Conversely, insiders often decrease their ownership over time. Companies that have been privatized tend to have low insider ownership.
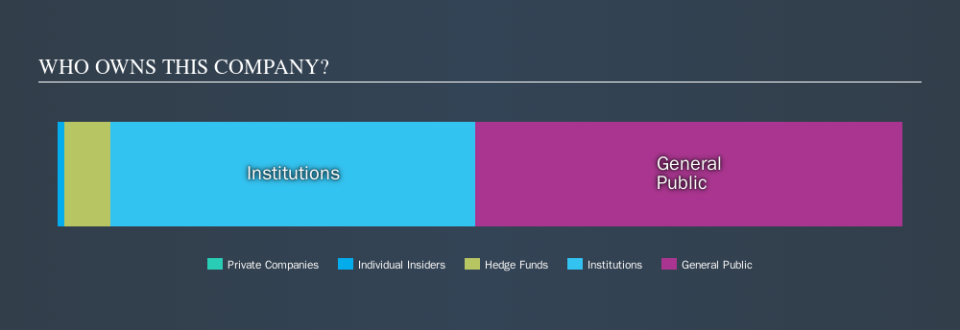
With a market capitalization of CA$635m, Fortuna Silver Mines is a small cap stock, so it might not be well known by many institutional investors. In the chart below below, we can see that institutions are noticeable on the share registry. Let's delve deeper into each type of owner, to discover more about FVI.
See our latest analysis for Fortuna Silver Mines
What Does The Institutional Ownership Tell Us About Fortuna Silver Mines?
Institutions typically measure themselves against a benchmark when reporting to their own investors, so they often become more enthusiastic about a stock once it's included in a major index. We would expect most companies to have some institutions on the register, especially if they are growing.
As you can see, institutional investors own 43% of Fortuna Silver Mines. This implies the analysts working for those institutions have looked at the stock and they like it. But just like anyone else, they could be wrong. If multiple institutions change their view on a stock at the same time, you could see the share price drop fast. It's therefore worth looking at Fortuna Silver Mines's earnings history, below. Of course, the future is what really matters.

Our data indicates that hedge funds own 5.5% of Fortuna Silver Mines. That's interesting, because hedge funds can be quite active and activist. Many look for medium term catalysts that will drive the share price higher. Quite a few analysts cover the stock, so you could look into forecast growth quite easily.
Insider Ownership Of Fortuna Silver Mines
The definition of company insiders can be subjective, and does vary between jurisdictions. Our data reflects individual insiders, capturing board members at the very least. Management ultimately answers to the board. However, it is not uncommon for managers to be executive board members, especially if they are a founder or the CEO.
Most consider insider ownership a positive because it can indicate the board is well aligned with other shareholders. However, on some occasions too much power is concentrated within this group.
Our data suggests that insiders own under 1% of Fortuna Silver Mines Inc. in their own names. It appears that the board holds about CA$5.7m worth of stock. This compares to a market capitalization of CA$635m. Many tend to prefer to see a board with bigger shareholdings. A good next step might be to take a look at this free summary of insider buying and selling.
General Public Ownership
The general public -- mostly retail investors -- own 50% of Fortuna Silver Mines. This level of ownership gives retail investors the power to sway key policy decisions such as board composition, executive compensation, and the dividend payout ratio.
Next Steps:
I find it very interesting to look at who exactly owns a company. But to truly gain insight, we need to consider other information, too.
I always like to check for a history of revenue growth. You can too, by accessing this free chart of historic revenue and earnings in this detailed graph.
If you would prefer discover what analysts are predicting in terms of future growth, do not miss this free report on analyst forecasts.
NB: Figures in this article are calculated using data from the last twelve months, which refer to the 12-month period ending on the last date of the month the financial statement is dated. This may not be consistent with full year annual report figures.
We aim to bring you long-term focused research analysis driven by fundamental data. Note that our analysis may not factor in the latest price-sensitive company announcements or qualitative material.
If you spot an error that warrants correction, please contact the editor at editorial-team@simplywallst.com. This article by Simply Wall St is general in nature. It does not constitute a recommendation to buy or sell any stock, and does not take account of your objectives, or your financial situation. Simply Wall St has no position in the stocks mentioned. Thank you for reading.
