
 Yahoo Finance
 Lagenda Properties Berhad (KLSE:LAGENDA) shareholders have earned a 30% CAGR over the last three years
The worst result, after buying shares in a company (assuming no leverage), would be if you lose all the money you put in. But in contrast you can make much more than 100% if the company does well. For example, the Lagenda Properties Berhad (KLSE:LAGENDA) share price has soared 103% in the last three years. How nice for those who held the stock! We note the stock price is up 1.6% in the last seven days.
So let's assess the underlying fundamentals over the last 3 years and see if they've moved in lock-step with shareholder returns.
See our latest analysis for Lagenda Properties Berhad
To quote Buffett, 'Ships will sail around the world but the Flat Earth Society will flourish. There will continue to be wide discrepancies between price and value in the marketplace...' One imperfect but simple way to consider how the market perception of a company has shifted is to compare the change in the earnings per share (EPS) with the share price movement.
Over the last three years, Lagenda Properties Berhad failed to grow earnings per share, which fell 19% (annualized).
So we doubt that the market is looking to EPS for its main judge of the company's value. Since the change in EPS doesn't seem to correlate with the change in share price, it's worth taking a look at other metrics.
Interestingly, the dividend has increased over time; so that may have given the share price a boost. Sometimes yield-chasing investors will flock to a company if they think the dividend can grow over time. On top of that, revenue grew at a rate of 16% per year, and it's likely investors interpret that as pointing to a brighter future.
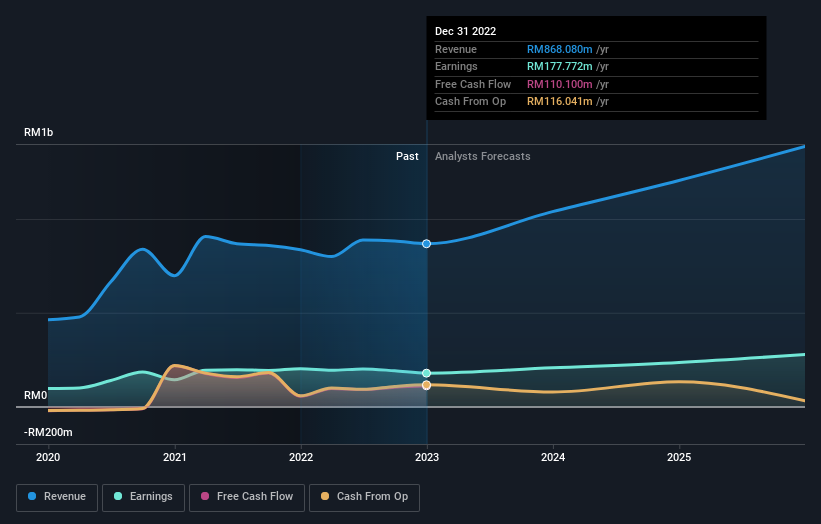
You can see below how earnings and revenue have changed over time (discover the exact values by clicking on the image).
Take a more thorough look at Lagenda Properties Berhad's financial health with this free report on its balance sheet.
What About Dividends?
When looking at investment returns, it is important to consider the difference between total shareholder return (TSR) and share price return. The TSR is a return calculation that accounts for the value of cash dividends (assuming that any dividend received was reinvested) and the calculated value of any discounted capital raisings and spin-offs. Arguably, the TSR gives a more comprehensive picture of the return generated by a stock. We note that for Lagenda Properties Berhad the TSR over the last 3 years was 121%, which is better than the share price return mentioned above. The dividends paid by the company have thusly boosted the total shareholder return.
A Different Perspective
We regret to report that Lagenda Properties Berhad shareholders are down 9.8% for the year (even including dividends). Unfortunately, that's worse than the broader market decline of 5.6%. Having said that, it's inevitable that some stocks will be oversold in a falling market. The key is to keep your eyes on the fundamental developments. On the bright side, long term shareholders have made money, with a gain of 13% per year over half a decade. It could be that the recent sell-off is an opportunity, so it may be worth checking the fundamental data for signs of a long term growth trend. I find it very interesting to look at share price over the long term as a proxy for business performance. But to truly gain insight, we need to consider other information, too. To that end, you should be aware of the 1 warning sign we've spotted with Lagenda Properties Berhad .
For those who like to find winning investments this free list of growing companies with recent insider purchasing, could be just the ticket.
Please note, the market returns quoted in this article reflect the market weighted average returns of stocks that currently trade on Malaysian exchanges.
Have feedback on this article? Concerned about the content? Get in touch with us directly. Alternatively, email editorial-team (at) simplywallst.com.
This article by Simply Wall St is general in nature. We provide commentary based on historical data and analyst forecasts only using an unbiased methodology and our articles are not intended to be financial advice. It does not constitute a recommendation to buy or sell any stock, and does not take account of your objectives, or your financial situation. We aim to bring you long-term focused analysis driven by fundamental data. Note that our analysis may not factor in the latest price-sensitive company announcements or qualitative material. Simply Wall St has no position in any stocks mentioned.
Join A Paid User Research Session
You’ll receive a US$30 Amazon Gift card for 1 hour of your time while helping us build better investing tools for the individual investors like yourself. Sign up here
