
 Yahoo Finance
 What Can We Make Of Lululemon Athletica Inc.’s (NASDAQ:LULU) High Return On Capital?

Today we’ll look at Lululemon Athletica Inc. (NASDAQ:LULU) and reflect on its potential as an investment. In particular, we’ll consider its Return On Capital Employed (ROCE), as that can give us insight into how profitably the company is able to employ capital in its business.
First up, we’ll look at what ROCE is and how we calculate it. Then we’ll compare its ROCE to similar companies. And finally, we’ll look at how its current liabilities are impacting its ROCE.
Return On Capital Employed (ROCE): What is it?
ROCE is a metric for evaluating how much pre-tax income (in percentage terms) a company earns on the capital invested in its business. Generally speaking a higher ROCE is better. In brief, it is a useful tool, but it is not without drawbacks. Author Edwin Whiting says to be careful when comparing the ROCE of different businesses, since ‘No two businesses are exactly alike.’
How Do You Calculate Return On Capital Employed?
Analysts use this formula to calculate return on capital employed:
Return on Capital Employed = Earnings Before Interest and Tax (EBIT) ÷ (Total Assets – Current Liabilities)
Or for Lululemon Athletica:
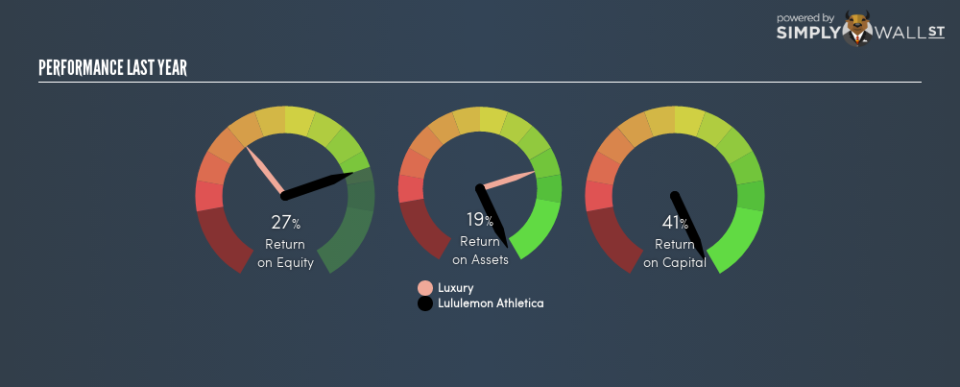
0.41 = US$496m ÷ (US$2.0b – US$444m) (Based on the trailing twelve months to October 2018.)
Therefore, Lululemon Athletica has an ROCE of 41%.
See our latest analysis for Lululemon Athletica
Want to help shape the future of investing tools and platforms? Take the survey and be part of one of the most advanced studies of stock market investors to date.
Is Lululemon Athletica’s ROCE Good?
ROCE can be useful when making comparisons, such as between similar companies. Using our data, we find that Lululemon Athletica’s ROCE is meaningfully better than the 14% average in the Luxury industry. We would consider this a positive, as it suggests it is using capital more effectively than other similar companies. Setting aside the comparison to its industry for a moment, Lululemon Athletica’s ROCE in absolute terms currently looks quite high.
In our analysis, Lululemon Athletica’s ROCE appears to be 41%, compared to 3 years ago, when its ROCE was 32%. This makes us wonder if the company is improving.
Remember that this metric is backwards looking – it shows what has happened in the past, and does not accurately predict the future. Companies in cyclical industries can be difficult to understand using ROCE, as returns typically look high during boom times, and low during busts. ROCE is only a point-in-time measure. What happens in the future is pretty important for investors, so we have prepared a free report on analyst forecasts for Lululemon Athletica.
How Lululemon Athletica’s Current Liabilities Impact Its ROCE
Current liabilities include invoices, such as supplier payments, short-term debt, or a tax bill, that need to be paid within 12 months. The ROCE equation subtracts current liabilities from capital employed, so a company with a lot of current liabilities appears to have less capital employed, and a higher ROCE than otherwise. To counter this, investors can check if a company has high current liabilities relative to total assets.
Lululemon Athletica has total liabilities of US$444m and total assets of US$2.0b. As a result, its current liabilities are equal to approximately 22% of its total assets. The fairly low level of current liabilities won’t have much impact on the already great ROCE.
Our Take On Lululemon Athletica’s ROCE
With low current liabilities and a high ROCE, Lululemon Athletica could be worthy of further investigation. Of course, you might find a fantastic investment by looking at a few good candidates. So take a peek at this free list of companies with modest (or no) debt, trading on a P/E below 20.
For those who like to find winning investments this free list of growing companies with recent insider purchasing, could be just the ticket.
To help readers see past the short term volatility of the financial market, we aim to bring you a long-term focused research analysis purely driven by fundamental data. Note that our analysis does not factor in the latest price-sensitive company announcements.
The author is an independent contributor and at the time of publication had no position in the stocks mentioned. For errors that warrant correction please contact the editor at editorial-team@simplywallst.com.
