
 Yahoo Finance
 Lululemon Athletica's (NASDAQ:LULU) earnings growth rate lags the 35% CAGR delivered to shareholders
The last three months have been tough on Lululemon Athletica Inc. (NASDAQ:LULU) shareholders, who have seen the share price decline a rather worrying 31%. But over five years returns have been remarkably great. In fact, during that period, the share price climbed 349%. Impressive! So it might be that some shareholders are taking profits after good performance. Of course what matters most is whether the business can improve itself sustainably, thus justifying a higher price.
While the stock has fallen 8.4% this week, it's worth focusing on the longer term and seeing if the stocks historical returns have been driven by the underlying fundamentals.
View our latest analysis for Lululemon Athletica
While the efficient markets hypothesis continues to be taught by some, it has been proven that markets are over-reactive dynamic systems, and investors are not always rational. One flawed but reasonable way to assess how sentiment around a company has changed is to compare the earnings per share (EPS) with the share price.
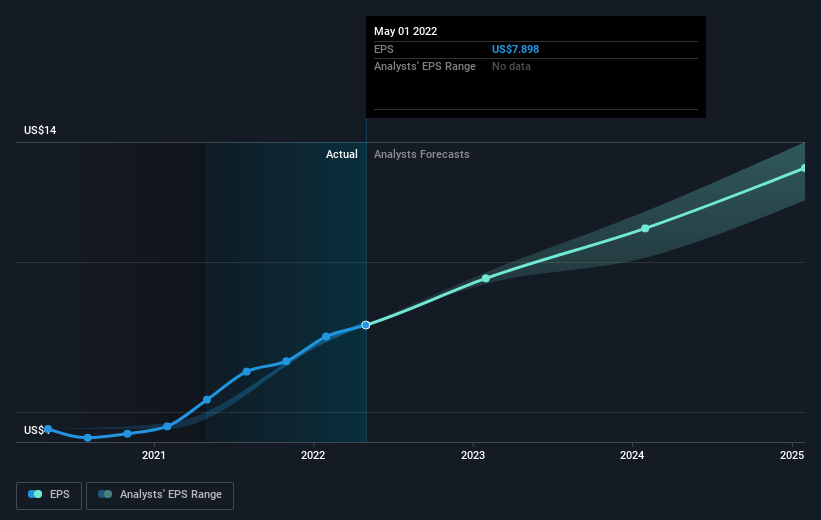
During five years of share price growth, Lululemon Athletica achieved compound earnings per share (EPS) growth of 31% per year. So the EPS growth rate is rather close to the annualized share price gain of 35% per year. This indicates that investor sentiment towards the company has not changed a great deal. Rather, the share price has approximately tracked EPS growth.
The graphic below depicts how EPS has changed over time (unveil the exact values by clicking on the image).
We know that Lululemon Athletica has improved its bottom line lately, but is it going to grow revenue? Check if analysts think Lululemon Athletica will grow revenue in the future.
A Different Perspective
We regret to report that Lululemon Athletica shareholders are down 29% for the year. Unfortunately, that's worse than the broader market decline of 20%. However, it could simply be that the share price has been impacted by broader market jitters. It might be worth keeping an eye on the fundamentals, in case there's a good opportunity. On the bright side, long term shareholders have made money, with a gain of 35% per year over half a decade. If the fundamental data continues to indicate long term sustainable growth, the current sell-off could be an opportunity worth considering. It's always interesting to track share price performance over the longer term. But to understand Lululemon Athletica better, we need to consider many other factors. For example, we've discovered 2 warning signs for Lululemon Athletica (1 is a bit unpleasant!) that you should be aware of before investing here.
But note: Lululemon Athletica may not be the best stock to buy. So take a peek at this free list of interesting companies with past earnings growth (and further growth forecast).
Please note, the market returns quoted in this article reflect the market weighted average returns of stocks that currently trade on US exchanges.
Have feedback on this article? Concerned about the content? Get in touch with us directly. Alternatively, email editorial-team (at) simplywallst.com.
This article by Simply Wall St is general in nature. We provide commentary based on historical data and analyst forecasts only using an unbiased methodology and our articles are not intended to be financial advice. It does not constitute a recommendation to buy or sell any stock, and does not take account of your objectives, or your financial situation. We aim to bring you long-term focused analysis driven by fundamental data. Note that our analysis may not factor in the latest price-sensitive company announcements or qualitative material. Simply Wall St has no position in any stocks mentioned.
