
 Yahoo Finance
 Market Participants Recognise Becton, Dickinson and Company's (NYSE:BDX) Earnings
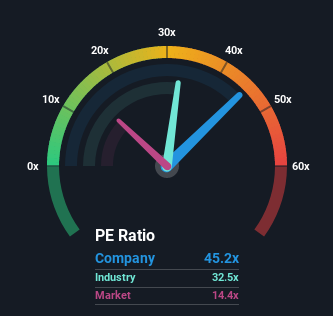
With a price-to-earnings (or "P/E") ratio of 45.2x Becton, Dickinson and Company (NYSE:BDX) may be sending very bearish signals at the moment, given that almost half of all companies in the United States have P/E ratios under 14x and even P/E's lower than 8x are not unusual. Although, it's not wise to just take the P/E at face value as there may be an explanation why it's so lofty.
Becton Dickinson could be doing better as it's been growing earnings less than most other companies lately. It might be that many expect the uninspiring earnings performance to recover significantly, which has kept the P/E from collapsing. You'd really hope so, otherwise you're paying a pretty hefty price for no particular reason.
View our latest analysis for Becton Dickinson
Keen to find out how analysts think Becton Dickinson's future stacks up against the industry? In that case, our free report is a great place to start.
Is There Enough Growth For Becton Dickinson?
Becton Dickinson's P/E ratio would be typical for a company that's expected to deliver very strong growth, and importantly, perform much better than the market.
Retrospectively, the last year delivered a decent 3.6% gain to the company's bottom line. The latest three year period has also seen an excellent 36% overall rise in EPS, aided somewhat by its short-term performance. So we can start by confirming that the company has done a great job of growing earnings over that time.
Looking ahead now, EPS is anticipated to climb by 22% per year during the coming three years according to the analysts following the company. Meanwhile, the rest of the market is forecast to only expand by 9.0% each year, which is noticeably less attractive.
With this information, we can see why Becton Dickinson is trading at such a high P/E compared to the market. Apparently shareholders aren't keen to offload something that is potentially eyeing a more prosperous future.
The Bottom Line On Becton Dickinson's P/E
Typically, we'd caution against reading too much into price-to-earnings ratios when settling on investment decisions, though it can reveal plenty about what other market participants think about the company.
As we suspected, our examination of Becton Dickinson's analyst forecasts revealed that its superior earnings outlook is contributing to its high P/E. At this stage investors feel the potential for a deterioration in earnings isn't great enough to justify a lower P/E ratio. It's hard to see the share price falling strongly in the near future under these circumstances.
And what about other risks? Every company has them, and we've spotted 1 warning sign for Becton Dickinson you should know about.
If these risks are making you reconsider your opinion on Becton Dickinson, explore our interactive list of high quality stocks to get an idea of what else is out there.
Have feedback on this article? Concerned about the content? Get in touch with us directly. Alternatively, email editorial-team (at) simplywallst.com.
This article by Simply Wall St is general in nature. We provide commentary based on historical data and analyst forecasts only using an unbiased methodology and our articles are not intended to be financial advice. It does not constitute a recommendation to buy or sell any stock, and does not take account of your objectives, or your financial situation. We aim to bring you long-term focused analysis driven by fundamental data. Note that our analysis may not factor in the latest price-sensitive company announcements or qualitative material. Simply Wall St has no position in any stocks mentioned.
Join A Paid User Research Session
You’ll receive a US$30 Amazon Gift card for 1 hour of your time while helping us build better investing tools for the individual investors like yourself. Sign up here
