
 Yahoo Finance
 Market Unimpressed with Bank Earnings


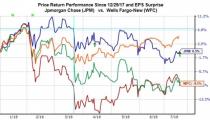


It isn’t hard to appreciate the market’s negative reaction to the Wells Fargo (WFC) and Citigroup (C) reports, but the lukewarm reaction to JPMorgan (JPM) report is likely reflective of continued weak sentiment for the group.
The fact is that JPMorgan’s report represented all around strength and offers useful read-throughs for what to expect from pure-play investment banks, trust banks and regional operators in the coming days. We have a busy reporting docket this week, with more than 170 companies coming out with quarterly results, including 60 S&P 500 members.
As you can see in the year-to-date performance comparison of Citi, JPMorgan, and Wells Fargo shares relative to the S&P 500 index (orange line), the banks have lagged the broader market, with Citi and Wells doing real bad.
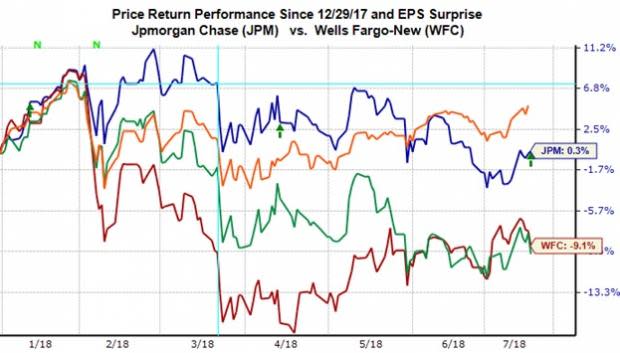
As discussed in this space last week, a big contributor to the group’s recent underperformance is the flattening yield curve. Lately, yield spreads have compressed significantly as the shorter end of the curve has gained ground in response to the market’s Fed expectations while long-term yields have been held down by lack of inflation expectations and safe-haven flows around the trade uncertainty.
With respect to the actual results, there is plenty to like in the JPMorgan report while Citi’s results were modestly disappointing and Wells’ report was weak as well as ‘noisy’. JPMorgan’s loan portfolio increased a respectable +4% from the same period last year and +2% from the preceding period. Earnings at the bank’s investment banking unit increased +18% from the year-earlier period, with trading revenues increasing +13%. The one area of weakness was the mortgage unit, with mortgage volume down -10% and revenues down -6% from the year-earlier period.
Mortgages are a much bigger deal with Wells Fargo, with earnings in the bank’s mortgage unit down by almost a third from the same period last year and the overall loan portfolio down -1.4% from the earlier period. The bank had a number of ‘charges’ in its report as well, though we don’t exclude these charges from the bank’s ‘recurring’ earnings as these charges have effectively become a regular part of its results as it continues to put the September 2016 scandal behind it. The combination of increased outlays for regulatory and compliance strictures and weakness in the mortgage business resulted in -2.5% lower earnings on -2.8% reduction in revenues.
The Citi disappointment is centered primarily on weakness in trading and credit cards, with trading revenues down -1% from the year-earlier period even though management had guided towards a flat showing on this count. The bank’s loan portfolio was up +4% while expenses were flat from the year-earlier period. Thanks to lower taxes, Citi’s Q2 earnings were up +16.2% from the same period last year on +3.2% higher revenues.
Finance Sector Scorecard (as of Friday, July 13th)
We now have Q2 results from 4 of the 99 Finance sector companies in the S&P 500 index. Keep in mind however that these 4 companies account for 21.3% of the sector’s total market capitalization in the index.
Total earnings for these 4 Finance companies are up +11.4% from the same period last year on +3.6% higher revenue growth, with 75% beating EPS estimates and 100% beating revenue estimates. The comparison charts below put the results thus far in a historical context.
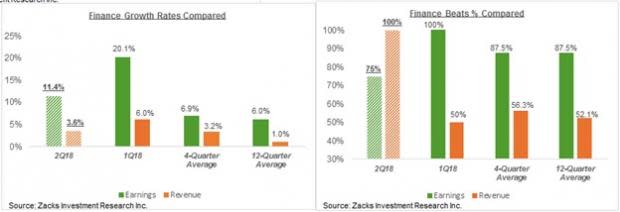
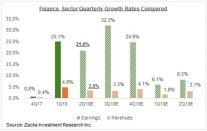
As you can see in the chart above, the sector’s growth picture is tracking above the 4- and 12-quarter averages, but below what we had seen from these stocks in the preceding quarter. These comparisons will likely change as Bank of America (BAC), Goldman Sachs (GS) and Morgan Stanley (MS) report quarterly results next week.
For the quarter as a whole, total Finance sector earnings are expected to be up +21% from the same period last year on +3.6% higher revenues. This would follow +25.1% earnings growth in 2018 Q1 on +4.8% higher revenues.
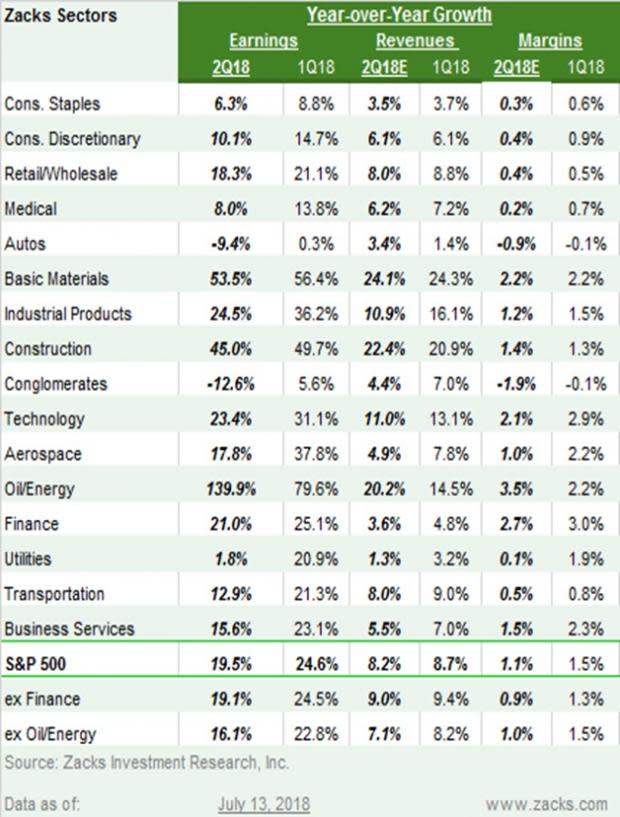
The table below shows the sector’s Q2 earnings expectations at the medium industry level. We show Q2 expectations in the context of what was actually reported in the preceding three quarters and what is expected in the following four periods at the medium-industry level.

The chart below shows the same data at the aggregate sector level. The strong earnings growth of the first half of 2018 is expected to continue in the back half as well.
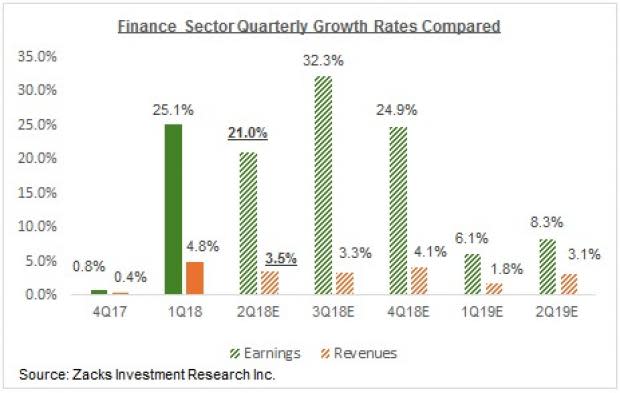
Please note that the sector’s strong growth this year is for the most part to thanks to the tax legislation. You can see that in the above chart by focusing on the revenue growth pace (orange bars). Revenue growth for the group is positive, but nothing to get overly excited about.
Q2 Earnings Season Scorecard (as of July 13th, 2018)
We now have Q2 results from 27 S&P 500 members, with total earnings for these 27 companies up +19.1% from the same period last year on +9.7% higher revenues, with 88.9% of the companies beating EPS and revenue estimates.
We probably shouldn’t draw any firm conclusions from the results thus far, but this is nevertheless a good start to the Q2 reporting cycle, as the comparison charts below show.

The way to read these charts is that Q2 earnings and revenue growth (left-hand chart) for these 27 index members is above the 4- and 12-qurater averages, but the comparison to the preceding period (2018 Q1) is mixed, with earnings growth (+19.1%) tracking below and revenue growth (+9.7%) inline.
Overall Expectations for 2018 Q2
Looking at Q2 as a whole, combining the actual results from the 27 index members with estimates from the still-to-come 473 companies, total earnings are expected to be up +19.5% from the same period last year on +8.2% higher revenues, with double-digit earnings growth for 11 of the 16 Zacks sectors. This would follow +24.6% earnings growth in 2018 Q1 on +8.7% revenue growth, the highest growth in almost 7 years.
The table below shows the summary picture for Q2, contrasted with what was actually achieved in Q1.
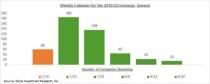
The chart below of weekly reporting calendar for the S&P 500 index shows that we will be in a good position to gauge trends by the end of this week, as we will have seen results from 87 index members by then.

The Earnings Growth Peak
The chart below compares current Q2 earnings growth expectations with what was actually achieved in the preceding 5 quarters and what is expected in the following 4 quarters.

When market commentators talk about earnings growth peak, it is the growth comparison in this chart they are referring to. Looking at this chart, it is obvious that growth has peaked already, with the pace decelerating going forward.
We should keep in mind however that actual results typically come in better than expected, with actuals exceeding estimates in the 3% to 5% range. This means that the 19.5% growth pace currently expected in Q2 will likely be closer to the 2018 Q1 tally when all is said and done.
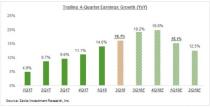
The chart below shows the growth pace on trailing 4-quarter basis, which tends to smooth out the quarter-to-quarter jumps.
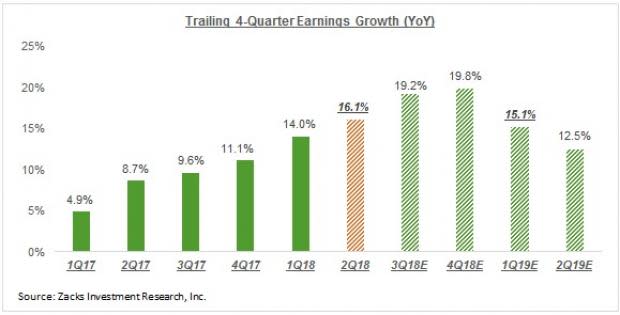
The two charts above provide different answers to the ‘peak earnings’ question. The first chart shows that the growth rate likely peaked in 2018 Q1, while second chart shows the expected to ‘peak’ to arrive in the last quarter of the year.
We should keep in mind that this earnings cycle got underway back in 2009 when the U.S. economy got out of its last recession. By this time, earnings growth should have come down to the historical ‘normalized’ pace in the mid-single digits level. The reason we have these impressive growth numbers is thanks mostly to the effect of the tax cuts, which will start wearing off towards the end of 2019.
In other words, earnings likely haven’t peaked yet. But with this cycle so long in tooth, we are steadily moving towards that stage.
Note: Sheraz Mian manages the Zacks equity research department. He is an acknowledged earnings expert whose commentaries and analyses appear on Zacks.com and in the print and electronic media. His weekly earnings related articles include Earnings Trends and Earnings Preview. He manages the Zacks Top 10 and Focus List portfolios and writes the Weekly Market Analysis article for Zacks Premium subscribers.
The Hottest Tech Mega-Trend of All
Last year, it generated $8 billion in global revenues. By 2020, it's predicted to blast through the roof to $47 billion. Famed investor Mark Cuban says it will produce "the world's first trillionaires," but that should still leave plenty of money for regular investors who make the right trades early.
See Zacks' 3 Best Stocks to Play This Trend >>
Here is a list of the 172 companies including 60 S&P 500 and reporting this week.
Company | Ticker | Current Qtr | Year-Ago Qtr | Last EPS Surprise % | Report Day | Time |
BANK OF AMER CP | BAC | 0.63 | 0.46 | 5.08% | Monday | BTO |
BLACKROCK INC | BLK | 6.6 | 5.24 | 4.52% | Monday | BTO |
HUNT (JB) TRANS | JBHT | 1.28 | 0.88 | -1.83% | Monday | BTO |
SUPERCOM LTD | SPCB | -0.05 | 0.01 | N/A | Monday | BTO |
NETFLIX INC | NFLX | 0.8 | 0.15 | 1.59% | Monday | AMC |
AVID BIOSERVICS | CDMO | -0.15 | -0.16 | -64.29% | Monday | AMC |
FIRST DEFIANCE | FDEF | 1.02 | 0.82 | 17.35% | Monday | AMC |
SANDVIK AB | SDVKY | 0.26 | 0.2 | 42.11% | Tuesday | N/A |
OMNICOM GRP | OMC | 1.55 | 1.4 | 8.57% | Tuesday | BTO |
PROLOGIS INC | PLD | 0.71 | 0.84 | 8.11% | Tuesday | BTO |
COMERICA INC | CMA | 1.65 | 1.15 | -1.28% | Tuesday | BTO |
SCHWAB(CHAS) | SCHW | 0.58 | 0.39 | 1.85% | Tuesday | BTO |
JOHNSON & JOHNS | JNJ | 2.06 | 1.83 | 2.49% | Tuesday | BTO |
GOLDMAN SACHS | GS | 4.67 | 3.95 | 22.57% | Tuesday | BTO |
UNITEDHEALTH GP | UNH | 3.03 | 2.46 | 4.11% | Tuesday | BTO |
PROGRESSIVE COR | PGR | 1.07 | 0.59 | 3.39% | Tuesday | BTO |
FIRST HRZN NATL | FHN | 0.36 | 0.27 | 13.33% | Tuesday | BTO |
MERCANTILE BANK | MBWM | 0.57 | 0.45 | 17.86% | Tuesday | BTO |
NEOGEN CORP | NEOG | 0.3 | 0.24 | 33.33% | Tuesday | BTO |
NATIONSTAR MTGE | NSM | 0.52 | 0.43 | 10.00% | Tuesday | BTO |
TELENOR ASA-ADS | TELNY | N/A | 0.27 | N/A | Tuesday | BTO |
UNITED CONT HLD | UAL | 3.07 | 2.75 | 2.04% | Tuesday | AMC |
CSX CORP | CSX | 0.86 | 0.64 | 18.18% | Tuesday | AMC |
ADTRAN INC | ADTN | -0.29 | 0.27 | -68.42% | Tuesday | AMC |
LEGACY TX FINL | LTXB | 0.66 | 0.59 | -27.78% | Tuesday | AMC |
FNF GROUP | FNF | 0.83 | 0.75 | 0.00% | Tuesday | AMC |
RENASANT CORP | RNST | 0.74 | 0.61 | 1.45% | Tuesday | AMC |
WINTRUST FINL | WTFC | 1.44 | 1.11 | 8.53% | Tuesday | AMC |
HANCOCK HLDG CO | HWC | 0.94 | 0.68 | 0.00% | Tuesday | AMC |
FULTON FINL | FULT | 0.13 | 0.26 | -3.45% | Tuesday | AMC |
HOPE BANCORP | HOPE | 0.37 | 0.3 | 0.00% | Tuesday | AMC |
PINNACLE FIN PT | PNFP | 1.14 | 0.84 | 3.67% | Tuesday | AMC |
MARTEN TRANS | MRTN | 0.22 | 0.17 | 0.00% | Tuesday | AMC |
AMER MOVIL-ADR | AMX | 0.16 | 0.23 | -42.00% | Tuesday | AMC |
INTERACTIVE BRK | IBKR | 0.46 | 0.32 | 12.50% | Tuesday | AMC |
UTD COMM FIN CP | UCFC | 0.19 | 0.16 | 0.00% | Tuesday | AMC |
UNITED FIN BCP | UBNK | 0.29 | 0.32 | 7.14% | Tuesday | AMC |
MELLANOX TECH | MLNX | 0.79 | 0.1 | 32.08% | Tuesday | AMC |
Kinder Morgan | KMI | 0.19 | 0.14 | 4.76% | Wednesday | N/A |
AKZO NOBEL NV | AKZOY | N/A | 0.49 | 16.13% | Wednesday | N/A |
US BANCORP | USB | 1.01 | 0.85 | 1.06% | Wednesday | BTO |
ABBOTT LABS | ABT | 0.71 | 0.62 | 1.72% | Wednesday | BTO |
GRAINGER W W | GWW | 3.77 | 2.74 | 22.58% | Wednesday | BTO |
NORTHERN TRUST | NTRS | 1.63 | 1.18 | 13.38% | Wednesday | BTO |
TEXTRON INC | TXT | 0.7 | 0.6 | 56.52% | Wednesday | BTO |
MORGAN STANLEY | MS | 1.08 | 0.87 | 13.28% | Wednesday | BTO |
M&T BANK CORP | MTB | 3.17 | 2.38 | 7.30% | Wednesday | BTO |
UNION BANKSHARS | UBSH | 0.62 | 0.46 | 9.26% | Wednesday | BTO |
AB ELECTROLUX | ELUXY | N/A | 1.03 | N/A | Wednesday | BTO |
ERICSSON LM ADR | ERIC | 0.02 | 0.02 | 133.33% | Wednesday | BTO |
NOVARTIS AG-ADR | NVS | 1.28 | 1.21 | 2.40% | Wednesday | BTO |
ASML HOLDING NV | ASML | 1.44 | 1.08 | 12.32% | Wednesday | BTO |
MGIC INVSTMT CP | MTG | 0.35 | 0.31 | 8.57% | Wednesday | BTO |
EBAY INC | EBAY | 0.39 | 0.34 | -6.82% | Wednesday | AMC |
AMER EXPRESS CO | AXP | 1.83 | 1.47 | 8.77% | Wednesday | AMC |
SL GREEN REALTY | SLG | 1.68 | 1.78 | 0.61% | Wednesday | AMC |
INTL BUS MACH | IBM | 3.03 | 2.97 | 2.08% | Wednesday | AMC |
CROWN CASTLE | CCI | 1.27 | 1.2 | 7.94% | Wednesday | AMC |
UTD RENTALS INC | URI | 3.5 | 2.37 | 20.59% | Wednesday | AMC |
CDN PAC RLWY | CP | 2.4 | 2.06 | -1.39% | Wednesday | AMC |
PTC INC | PTC | 0.2 | 0.14 | 25.00% | Wednesday | AMC |
CROWN HLDGS INC | CCK | 1.58 | 1.12 | 17.50% | Wednesday | AMC |
CVB FINL | CVBF | 0.31 | 0.26 | 3.23% | Wednesday | AMC |
PREFERRED BANK | PFBC | 1.09 | 0.8 | 1.87% | Wednesday | AMC |
BADGER METER | BMI | 0.4 | 0.36 | -33.33% | Wednesday | AMC |
STEWART INFO SV | STC | N/A | 0.79 | -35.21% | Wednesday | AMC |
UNIVL FST PRODS | UFPI | 0.75 | 0.55 | 7.14% | Wednesday | AMC |
TEXAS CAP BCSHS | TCBI | 1.38 | 0.97 | 0.73% | Wednesday | AMC |
UMPQUA HLDGS CP | UMPQ | 0.34 | 0.26 | 25.00% | Wednesday | AMC |
ALCOA CORP | AA | 1.35 | 0.62 | 28.33% | Wednesday | AMC |
CATHAY GENL BCP | CATY | 0.9 | 0.64 | -1.27% | Wednesday | AMC |
TRISTATE CP HLD | TSC | 0.37 | 0.29 | 5.88% | Wednesday | AMC |
BERKSHIRE HILLS | BHLB | 0.7 | 0.58 | 1.56% | Wednesday | AMC |
BOSTON PRIV FIN | BPFH | 0.23 | 0.27 | 13.64% | Wednesday | AMC |
PLEXUS CORP | PLXS | 0.82 | 0.74 | -1.33% | Wednesday | AMC |
EAGLE BCP INC | EGBN | 1.06 | 0.81 | 0.97% | Wednesday | AMC |
RESOURCES CNCTN | RECN | 0.28 | 0.2 | 20.00% | Wednesday | AMC |
CONSOL TOMOKA | CTO | 1.18 | 0.67 | -21.81% | Wednesday | AMC |
GREAT SOUTH BCP | GSBC | 0.92 | 1.14 | 9.20% | Wednesday | AMC |
RLI CORP | RLI | 0.53 | 0.61 | 15.38% | Wednesday | AMC |
BANCORPSOUTH BK | BXS | 0.55 | 0.42 | 8.00% | Wednesday | AMC |
NOODLES & CO | NDLS | 0.03 | 0.01 | -100.00% | Wednesday | AMC |
TRIUMPH BANCORP | TBK | 0.52 | 0.51 | -5.45% | Wednesday | AMC |
COHEN&STRS INC | CNS | 0.62 | 0.5 | 1.64% | Wednesday | AMC |
ADVA OPTICAL | ADVOF | 0.1 | 0.1 | -185.71% | Thursday | N/A |
DOVER CORP | DOV | 1.21 | 1.04 | 2.65% | Thursday | BTO |
SNAP-ON INC | SNA | 2.95 | 2.6 | 2.20% | Thursday | BTO |
BB&T CORP | BBT | 1.01 | 0.78 | 5.43% | Thursday | BTO |
KEYCORP NEW | KEY | 0.42 | 0.34 | 0.00% | Thursday | BTO |
FIFTH THIRD BK | FITB | 0.57 | 0.46 | 18.75% | Thursday | BTO |
PPG INDS INC | PPG | 1.89 | 1.83 | -1.42% | Thursday | BTO |
UNION PAC CORP | UNP | 1.93 | 1.45 | 1.82% | Thursday | BTO |
DANAHER CORP | DHR | 1.09 | 0.99 | 5.32% | Thursday | BTO |
PHILIP MORRIS | PM | 1.23 | 1.14 | 13.64% | Thursday | BTO |
TRAVELERS COS | TRV | 2.44 | 1.92 | -8.21% | Thursday | BTO |
BANK OF NY MELL | BK | 1.03 | 0.92 | 13.40% | Thursday | BTO |
ALLIANCE DATA | ADS | 4.36 | 3.58 | 3.02% | Thursday | BTO |
GENUINE PARTS | GPC | 1.56 | 1.29 | -3.79% | Thursday | BTO |
NUCOR CORP | NUE | 2.12 | 1 | 6.36% | Thursday | BTO |
VOLVO AB-B | VLVLY | 0.36 | 0.33 | 3.03% | Thursday | BTO |
SONOCO PRODUCTS | SON | 0.86 | 0.71 | 2.78% | Thursday | BTO |
COUNTY BANCORP | ICBK | 0.54 | 0.29 | 11.54% | Thursday | BTO |
WEBSTER FINL CP | WBS | 0.87 | 0.64 | 7.59% | Thursday | BTO |
WABCO HOLDINGS | WBC | 1.9 | 1.69 | 7.65% | Thursday | BTO |
BLACKSTONE GRP | BX | 0.7 | 0.59 | 41.30% | Thursday | BTO |
DOMINOS PIZZA | DPZ | 1.76 | 1.32 | 12.99% | Thursday | BTO |
RPM INTL INC | RPM | 1.18 | 1.02 | 16.67% | Thursday | BTO |
ROGERS COMM CLB | RCI | 0.81 | 0.74 | 18.33% | Thursday | BTO |
TILE SHOP HLDGS | TTS | 0.09 | 0.15 | 14.29% | Thursday | BTO |
S&T BANCORP INC | STBA | 0.6 | 0.65 | 7.14% | Thursday | BTO |
ABB LTD-ADR | ABB | 0.36 | 0.3 | 0.00% | Thursday | BTO |
SANDY SPRING | SASR | 0.8 | 0.61 | 6.67% | Thursday | BTO |
SAP SE | SAP | 0.98 | 0.76 | 43.86% | Thursday | BTO |
SCHOLASTIC CORP | SCHL | 1.39 | 1.31 | 14.29% | Thursday | BTO |
TAIWAN SEMI-ADR | TSM | 0.45 | 0.42 | -1.67% | Thursday | BTO |
UNILEVER PLC | UL | N/A | N/A | N/A | Thursday | BTO |
UNILEVER N V | UN | N/A | N/A | N/A | Thursday | BTO |
EAST WEST BC | EWBC | 1.09 | 0.81 | 13.00% | Thursday | BTO |
GATX CORP | GATX | 0.92 | 1.32 | 69.23% | Thursday | BTO |
HOME BANCSHARES | HOMB | 0.44 | 0.35 | 2.44% | Thursday | BTO |
POOL CORP | POOL | 2.84 | 2.21 | 7.14% | Thursday | BTO |
COMP TASK | CTG | 0.08 | 0.06 | 0.00% | Thursday | BTO |
WNS HLDGS-ADR | WNS | 0.4 | 0.37 | 23.91% | Thursday | BTO |
SYNTEL INC | SYNT | 0.44 | 0.44 | 25.00% | Thursday | BTO |
CHART INDUSTRIE | GTLS | 0.45 | 0.21 | 21.05% | Thursday | BTO |
MICROSOFT CORP | MSFT | 1.07 | 0.98 | 11.76% | Thursday | AMC |
CAPITAL ONE FIN | COF | 2.62 | 1.96 | 13.25% | Thursday | AMC |
E TRADE FINL CP | ETFC | 0.89 | 0.52 | 11.39% | Thursday | AMC |
CINTAS CORP | CTAS | 1.65 | 1.18 | 10.48% | Thursday | AMC |
PEOPLES UTD FIN | PBCT | 0.32 | 0.24 | 0.00% | Thursday | AMC |
SKYWORKS SOLUTN | SWKS | 1.4 | 1.46 | 2.74% | Thursday | AMC |
INTUITIVE SURG | ISRG | 2.02 | 1.68 | 47.88% | Thursday | AMC |
BRANDYWINE RT | BDN | 0.34 | 0.34 | 0.00% | Thursday | AMC |
MB FINANCL INC | MBFI | 0.68 | 0.54 | 1.59% | Thursday | AMC |
SKECHERS USA-A | SKX | 0.4 | 0.38 | 0.00% | Thursday | AMC |
FIRST FIN BC-OH | FFBC | 0.51 | 0.37 | 13.04% | Thursday | AMC |
EXPONENT INC | EXPO | 0.3 | 0.25 | -1.61% | Thursday | AMC |
EQUITY BANCSHRS | EQBK | N/A | 0.51 | -4.08% | Thursday | AMC |
SERVISFIRST BCS | SFBS | 0.58 | 0.45 | 3.45% | Thursday | AMC |
EASTGROUP PPTYS | EGP | 1.12 | 1.05 | 5.45% | Thursday | AMC |
WESTERN ALLIANC | WAL | 0.98 | 0.76 | 3.23% | Thursday | AMC |
GLACIER BANCORP | GBCI | 0.53 | 0.43 | -7.69% | Thursday | AMC |
LIMELIGHT NETWK | LLNW | 0 | 0 | 300.00% | Thursday | AMC |
NORTHWESTERN CP | NWE | 0.44 | 0.47 | -1.67% | Thursday | AMC |
ENTEGRA FINL CP | ENFC | 0.52 | 0.36 | 6.00% | Thursday | AMC |
SB FINANCIAL GP | SBFG | 0.38 | 0.37 | 12.90% | Thursday | AMC |
ASSOC BANC CORP | ASB | 0.48 | 0.36 | 21.95% | Thursday | AMC |
CELANESE CP-A | CE | 2.37 | 1.79 | 18.22% | Thursday | AMC |
QCR HLDGS INC | QCRH | 0.79 | 0.65 | 5.63% | Thursday | AMC |
SEI INVESTMENTS | SEIC | 0.75 | 0.57 | 11.69% | Thursday | AMC |
INDEP BK MASS | INDB | 1.11 | 0.82 | -2.91% | Thursday | AMC |
STORA ENSO -ADR | SEOAY | N/A | 0.21 | 33.33% | Friday | N/A |
GENL ELECTRIC | GE | 0.18 | 0.28 | 45.45% | Friday | BTO |
BAKER HUGHES GE | BHGE | 0.14 | -0.11 | 50.00% | Friday | BTO |
KANSAS CITY SOU | KSU | 1.52 | 1.33 | -3.70% | Friday | BTO |
REGIONS FINL CP | RF | 0.33 | 0.25 | 12.90% | Friday | BTO |
SUNTRUST BKS | STI | 1.3 | 1.03 | 16.22% | Friday | BTO |
SCHLUMBERGER LT | SLB | 0.43 | 0.35 | 0.00% | Friday | BTO |
CITIZENS FIN GP | CFG | 0.86 | 0.63 | 2.63% | Friday | BTO |
STATE ST CORP | STT | 2.01 | 1.67 | 2.53% | Friday | BTO |
STANLEY B&D INC | SWK | 2.03 | 2.01 | 2.96% | Friday | BTO |
HONEYWELL INTL | HON | 2 | 1.8 | 3.17% | Friday | BTO |
V F CORP | VFC | 0.33 | 0.29 | 3.08% | Friday | BTO |
BANCO LATINOAME | BLX | 0.57 | 0.44 | -15.52% | Friday | BTO |
GENTEX CORP | GNTX | 0.41 | 0.31 | 0.00% | Friday | BTO |
MANPOWER INC WI | MAN | 2.35 | 1.82 | 4.24% | Friday | BTO |
IBERIABANK CORP | IBKC | 1.59 | 1.1 | -3.52% | Friday | BTO |
WIPRO LTD-ADR | WIT | 0.06 | 0.07 | -14.29% | Friday | BTO |
OFG BANCORP | OFG | 0.25 | 0.3 | 45.00% | Friday | BTO |
SENSIENT TECH | SXT | 0.92 | 0.87 | -1.11% | Friday | BTO |
CLEVELAND-CLIFF | CLF | 0.54 | 0.26 | 61.90% | Friday | BTO |
CEMENTOS PACASM | CPAC | N/A | 0.08 | 37.50% | Friday | AMC |
Want the latest recommendations from Zacks Investment Research? Today, you can download 7 Best Stocks for the Next 30 Days. Click to get this free report
Wells Fargo & Company (WFC) : Free Stock Analysis Report
Morgan Stanley (MS) : Free Stock Analysis Report
JPMorgan Chase & Co. (JPM) : Free Stock Analysis Report
The Goldman Sachs Group, Inc. (GS) : Free Stock Analysis Report
Citigroup Inc. (C) : Free Stock Analysis Report
Bank of America Corporation (BAC) : Free Stock Analysis Report
To read this article on Zacks.com click here.
Zacks Investment Research
