
 Yahoo Finance
 Here’s What Mercury NZ Limited’s (NZSE:MCY) P/E Ratio Is Telling Us

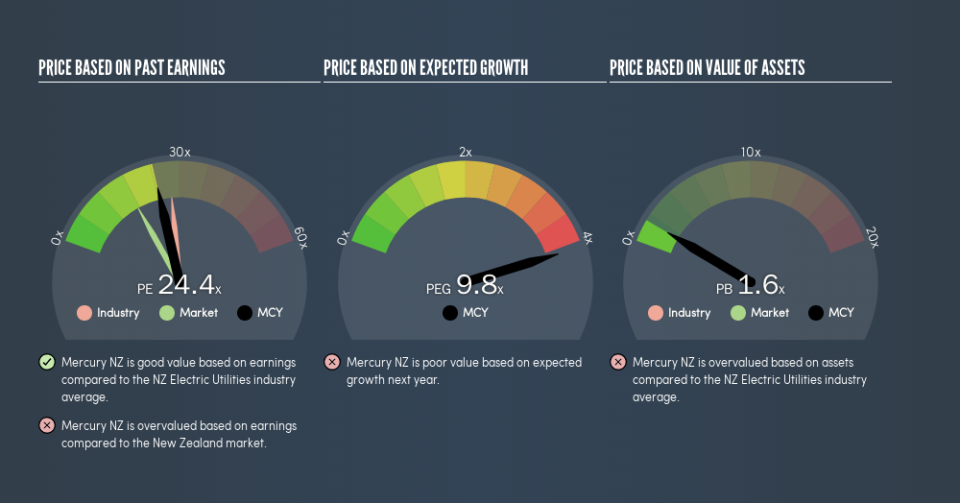
This article is for investors who would like to improve their understanding of price to earnings ratios (P/E ratios). We’ll show how you can use Mercury NZ Limited’s (NZSE:MCY) P/E ratio to inform your assessment of the investment opportunity. Based on the last twelve months, Mercury NZ’s P/E ratio is 24.41. That corresponds to an earnings yield of approximately 4.1%.
Check out our latest analysis for Mercury NZ
How Do You Calculate A P/E Ratio?
The formula for P/E is:
Price to Earnings Ratio = Price per Share ÷ Earnings per Share (EPS)
Or for Mercury NZ:
P/E of 24.41 = NZ$3.67 ÷ NZ$0.15 (Based on the year to December 2018.)
Is A High Price-to-Earnings Ratio Good?
A higher P/E ratio means that investors are paying a higher price for each NZ$1 of company earnings. That is not a good or a bad thing per se, but a high P/E does imply buyers are optimistic about the future.
How Growth Rates Impact P/E Ratios
P/E ratios primarily reflect market expectations around earnings growth rates. That’s because companies that grow earnings per share quickly will rapidly increase the ‘E’ in the equation. That means unless the share price increases, the P/E will reduce in a few years. A lower P/E should indicate the stock is cheap relative to others — and that may attract buyers.
Mercury NZ had pretty flat EPS growth in the last year. But over the longer term (5 years) earnings per share have increased by 12%.
How Does Mercury NZ’s P/E Ratio Compare To Its Peers?
The P/E ratio indicates whether the market has higher or lower expectations of a company. If you look at the image below, you can see Mercury NZ has a lower P/E than the average (27.7) in the electric utilities industry classification.
This suggests that market participants think Mercury NZ will underperform other companies in its industry. Since the market seems unimpressed with Mercury NZ, it’s quite possible it could surprise on the upside. If you consider the stock interesting, further research is recommended. For example, I often monitor director buying and selling.
Don’t Forget: The P/E Does Not Account For Debt or Bank Deposits
It’s important to note that the P/E ratio considers the market capitalization, not the enterprise value. In other words, it does not consider any debt or cash that the company may have on the balance sheet. Hypothetically, a company could reduce its future P/E ratio by spending its cash (or taking on debt) to achieve higher earnings.
Such expenditure might be good or bad, in the long term, but the point here is that the balance sheet is not reflected by this ratio.
Is Debt Impacting Mercury NZ’s P/E?
Mercury NZ’s net debt is 26% of its market cap. This is a reasonably significant level of debt — all else being equal you’d expect a much lower P/E than if it had net cash.
The Bottom Line On Mercury NZ’s P/E Ratio
Mercury NZ’s P/E is 24.4 which is above average (17.5) in the NZ market. With debt at prudent levels and improving earnings, it’s fair to say the market expects steady progress in the future.
Investors have an opportunity when market expectations about a stock are wrong. People often underestimate remarkable growth — so investors can make money when fast growth is not fully appreciated. So this free visual report on analyst forecasts could hold the key to an excellent investment decision.
Of course you might be able to find a better stock than Mercury NZ. So you may wish to see this free collection of other companies that have grown earnings strongly.
We aim to bring you long-term focused research analysis driven by fundamental data. Note that our analysis may not factor in the latest price-sensitive company announcements or qualitative material.
If you spot an error that warrants correction, please contact the editor at editorial-team@simplywallst.com. This article by Simply Wall St is general in nature. It does not constitute a recommendation to buy or sell any stock, and does not take account of your objectives, or your financial situation. Simply Wall St has no position in the stocks mentioned. Thank you for reading.
