
 Yahoo Finance
 Mercury NZ Limited's (NZSE:MCY) Financials Are Too Obscure To Link With Current Share Price Momentum: What's In Store For the Stock?
Most readers would already be aware that Mercury NZ's (NZSE:MCY) stock increased significantly by 29% over the past three months. However, we decided to pay attention to the company's fundamentals which don't appear to give a clear sign about the company's financial health. Specifically, we decided to study Mercury NZ's ROE in this article.
ROE or return on equity is a useful tool to assess how effectively a company can generate returns on the investment it received from its shareholders. Simply put, it is used to assess the profitability of a company in relation to its equity capital.
Check out our latest analysis for Mercury NZ
How Do You Calculate Return On Equity?
Return on equity can be calculated by using the formula:
Return on Equity = Net Profit (from continuing operations) ÷ Shareholders' Equity
So, based on the above formula, the ROE for Mercury NZ is:
5.5% = NZ$207m ÷ NZ$3.7b (Based on the trailing twelve months to June 2020).
The 'return' is the profit over the last twelve months. So, this means that for every NZ$1 of its shareholder's investments, the company generates a profit of NZ$0.06.
Why Is ROE Important For Earnings Growth?
We have already established that ROE serves as an efficient profit-generating gauge for a company's future earnings. We now need to evaluate how much profit the company reinvests or "retains" for future growth which then gives us an idea about the growth potential of the company. Generally speaking, other things being equal, firms with a high return on equity and profit retention, have a higher growth rate than firms that don’t share these attributes.
A Side By Side comparison of Mercury NZ's Earnings Growth And 5.5% ROE
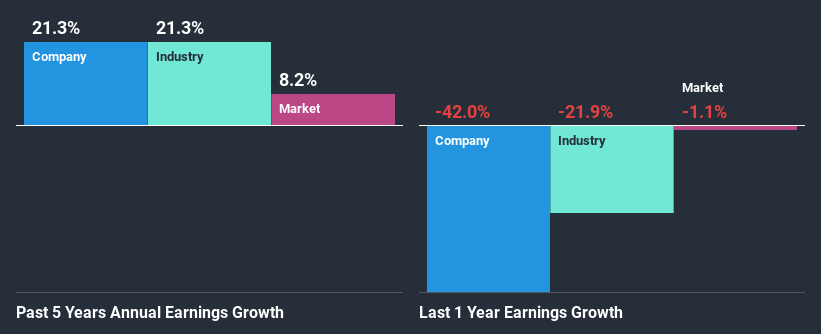
When you first look at it, Mercury NZ's ROE doesn't look that attractive. Yet, a closer study shows that the company's ROE is similar to the industry average of 5.5%. Moreover, we are quite pleased to see that Mercury NZ's net income grew significantly at a rate of 21% over the last five years. Taking into consideration that the ROE is not particularly high, we reckon that there could also be other factors at play which could be influencing the company's growth. For instance, the company has a low payout ratio or is being managed efficiently.
Next, on comparing Mercury NZ's net income growth with the industry, we found that the company's reported growth is similar to the industry average growth rate of 21% in the same period.
The basis for attaching value to a company is, to a great extent, tied to its earnings growth. It’s important for an investor to know whether the market has priced in the company's expected earnings growth (or decline). This then helps them determine if the stock is placed for a bright or bleak future. If you're wondering about Mercury NZ's's valuation, check out this gauge of its price-to-earnings ratio, as compared to its industry.
Is Mercury NZ Making Efficient Use Of Its Profits?
Mercury NZ's significant three-year median payout ratio of 94% (where it is retaining only 6.1% of its income) suggests that the company has been able to achieve a high growth in earnings despite returning most of its income to shareholders.
Moreover, Mercury NZ is determined to keep sharing its profits with shareholders which we infer from its long history of seven years of paying a dividend. Upon studying the latest analysts' consensus data, we found that the company's future payout ratio is expected to rise to 133% over the next three years. Regardless, the ROE is not expected to change much for the company despite the higher expected payout ratio.
Conclusion
On the whole, we feel that the performance shown by Mercury NZ can be open to many interpretations. Although the company has shown a pretty impressive growth in earnings, yet the low ROE and the low rate of reinvestment makes us skeptical about the continuity of that growth, especially when or if the business comes to face any threats. That being so, according to the latest industry analyst forecasts, the company's earnings are expected to shrink in the future. Are these analysts expectations based on the broad expectations for the industry, or on the company's fundamentals? Click here to be taken to our analyst's forecasts page for the company.
This article by Simply Wall St is general in nature. It does not constitute a recommendation to buy or sell any stock, and does not take account of your objectives, or your financial situation. We aim to bring you long-term focused analysis driven by fundamental data. Note that our analysis may not factor in the latest price-sensitive company announcements or qualitative material. Simply Wall St has no position in any stocks mentioned.
Have feedback on this article? Concerned about the content? Get in touch with us directly. Alternatively, email editorial-team (at) simplywallst.com.
