
 Yahoo Finance
 What You Must Know About Momo Inc.'s (NASDAQ:MOMO) Financial Strength

Stocks with market capitalization between $2B and $10B, such as Momo Inc. (NASDAQ:MOMO) with a size of US$5.8b, do not attract as much attention from the investing community as do the small-caps and large-caps. Despite this, commonly overlooked mid-caps have historically produced better risk-adjusted returns than their small and large-cap counterparts. Today we will look at MOMO’s financial liquidity and debt levels, which are strong indicators for whether the company can weather economic downturns or fund strategic acquisitions for future growth. Note that this information is centred entirely on financial health and is a top-level understanding, so I encourage you to look further into MOMO here.
Want to participate in a short research study? Help shape the future of investing tools and you could win a $250 gift card!
Check out our latest analysis for Momo
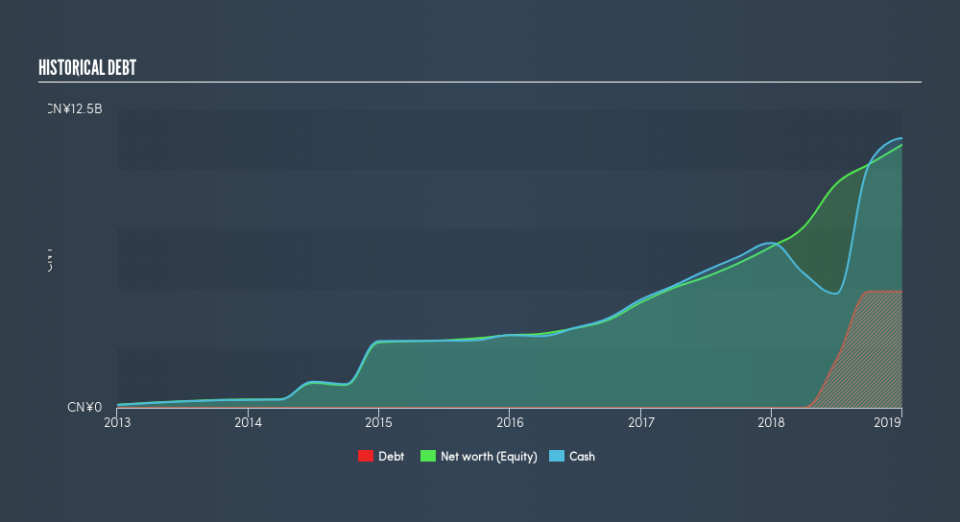
Does MOMO Produce Much Cash Relative To Its Debt?
In the previous 12 months, MOMO's rose by about CN¥4.9b including long-term debt. With this increase in debt, MOMO currently has CN¥11b remaining in cash and short-term investments , ready to be used for running the business. On top of this, MOMO has generated CN¥3.3b in operating cash flow over the same time period, leading to an operating cash to total debt ratio of 68%, indicating that MOMO’s debt is appropriately covered by operating cash.
Can MOMO pay its short-term liabilities?
Looking at MOMO’s CN¥2.7b in current liabilities, it appears that the company has been able to meet these commitments with a current assets level of CN¥13b, leading to a 4.69x current account ratio. The current ratio is calculated by dividing current assets by current liabilities. However, a ratio above 3x may be considered excessive by some investors, yet this is not usually a major negative for a company.
Does MOMO face the risk of succumbing to its debt-load?
With a debt-to-equity ratio of 44%, MOMO can be considered as an above-average leveraged company. This is not uncommon for a mid-cap company given that debt tends to be lower-cost and at times, more accessible.
Next Steps:
Although MOMO’s debt level is towards the higher end of the spectrum, its cash flow coverage seems adequate to meet obligations which means its debt is being efficiently utilised. Since there is also no concerns around MOMO's liquidity needs, this may be its optimal capital structure for the time being. This is only a rough assessment of financial health, and I'm sure MOMO has company-specific issues impacting its capital structure decisions. You should continue to research Momo to get a more holistic view of the mid-cap by looking at:
Future Outlook: What are well-informed industry analysts predicting for MOMO’s future growth? Take a look at our free research report of analyst consensus for MOMO’s outlook.
Valuation: What is MOMO worth today? Is the stock undervalued, even when its growth outlook is factored into its intrinsic value? The intrinsic value infographic in our free research report helps visualize whether MOMO is currently mispriced by the market.
Other High-Performing Stocks: Are there other stocks that provide better prospects with proven track records? Explore our free list of these great stocks here.
We aim to bring you long-term focused research analysis driven by fundamental data. Note that our analysis may not factor in the latest price-sensitive company announcements or qualitative material.
If you spot an error that warrants correction, please contact the editor at editorial-team@simplywallst.com. This article by Simply Wall St is general in nature. It does not constitute a recommendation to buy or sell any stock, and does not take account of your objectives, or your financial situation. Simply Wall St has no position in the stocks mentioned. Thank you for reading.
