
 Yahoo Finance
 What You Must Know About Port of Tauranga Limited’s (NZE:POT) Return on Equity

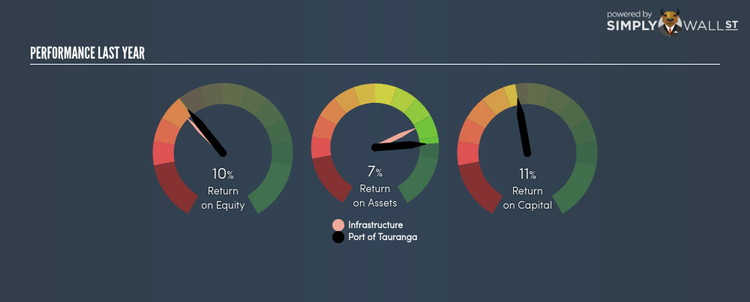
Port of Tauranga Limited (NZSE:POT) generated a below-average return on equity of 9.82% in the past 12 months, while its industry returned 11.26%. An investor may attribute an inferior ROE to a relatively inefficient performance, and whilst this can often be the case, knowing the nuts and bolts of the ROE calculation may change that perspective and give you a deeper insight into POT’s past performance. Today I will look at how components such as financial leverage can influence ROE which may impact the sustainability of POT’s returns. Check out our latest analysis for Port of Tauranga
Peeling the layers of ROE – trisecting a company’s profitability
Return on Equity (ROE) is a measure of Port of Tauranga’s profit relative to its shareholders’ equity. It essentially shows how much the company can generate in earnings given the amount of equity it has raised. In most cases, a higher ROE is preferred; however, there are many other factors we must consider prior to making any investment decisions.
Return on Equity = Net Profit ÷ Shareholders Equity
ROE is measured against cost of equity in order to determine the efficiency of Port of Tauranga’s equity capital deployed. Its cost of equity is 9.01%. Some of Port of Tauranga’s peers may have a higher ROE but its cost of equity could exceed this return, leading to an unsustainable negative discrepancy i.e. the company spends more than it earns. This is not the case for Port of Tauranga which is reassuring. ROE can be broken down into three different ratios: net profit margin, asset turnover, and financial leverage. This is called the Dupont Formula:
Dupont Formula
ROE = profit margin × asset turnover × financial leverage
ROE = (annual net profit ÷ sales) × (sales ÷ assets) × (assets ÷ shareholders’ equity)
ROE = annual net profit ÷ shareholders’ equity
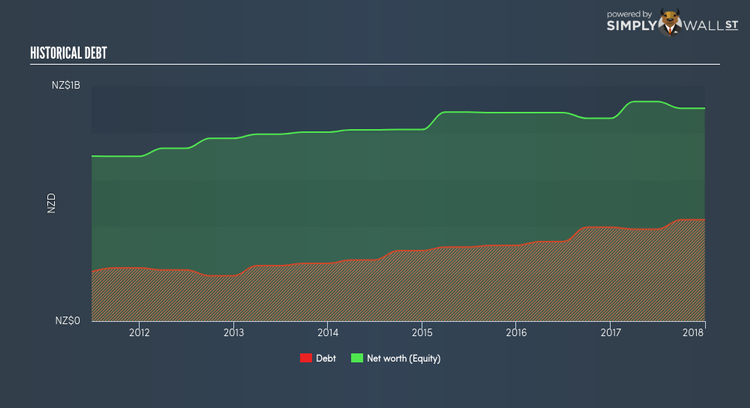
Essentially, profit margin shows how much money the company makes after paying for all its expenses. Asset turnover shows how much revenue Port of Tauranga can generate with its current asset base. The most interesting ratio, and reflective of sustainability of its ROE, is financial leverage. Since ROE can be inflated by excessive debt, we need to examine Port of Tauranga’s debt-to-equity level. At 47.70%, Port of Tauranga’s debt-to-equity ratio appears low and indicates that Port of Tauranga still has room to increase leverage and grow its profits.
Next Steps:
ROE is a simple yet informative ratio, illustrating the various components that each measure the quality of the overall stock. Even though Port of Tauranga returned below the industry average, its ROE comes in excess of its cost of equity. Also, ROE is not likely to be inflated by excessive debt funding, giving shareholders more conviction in the sustainability of returns, which has headroom to increase further. Although ROE can be a useful metric, it is only a small part of diligent research.
For Port of Tauranga, I’ve put together three pertinent aspects you should further research:
Financial Health: Does it have a healthy balance sheet? Take a look at our free balance sheet analysis with six simple checks on key factors like leverage and risk.
Valuation: What is Port of Tauranga worth today? Is the stock undervalued, even when its growth outlook is factored into its intrinsic value? The intrinsic value infographic in our free research report helps visualize whether Port of Tauranga is currently mispriced by the market.
Other High-Growth Alternatives : Are there other high-growth stocks you could be holding instead of Port of Tauranga? Explore our interactive list of stocks with large growth potential to get an idea of what else is out there you may be missing!
To help readers see pass the short term volatility of the financial market, we aim to bring you a long-term focused research analysis purely driven by fundamental data. Note that our analysis does not factor in the latest price sensitive company announcements.
The author is an independent contributor and at the time of publication had no position in the stocks mentioned.
