
 Yahoo Finance
 What You Must Know About Stampscom Inc’s (NASDAQ:STMP) Financial Health

Small-caps and large-caps are wildly popular among investors; however, mid-cap stocks, such as Stampscom Inc (NASDAQ:STMP) with a market-capitalization of US$3.1b, rarely draw their attention. However, generally ignored mid-caps have historically delivered better risk adjusted returns than both of those groups. Today we will look at STMP’s financial liquidity and debt levels, which are strong indicators for whether the company can weather economic downturns or fund strategic acquisitions for future growth. Don’t forget that this is a general and concentrated examination of Stamps.com’s financial health, so you should conduct further analysis into STMP here.
See our latest analysis for Stamps.com
Does STMP produce enough cash relative to debt?
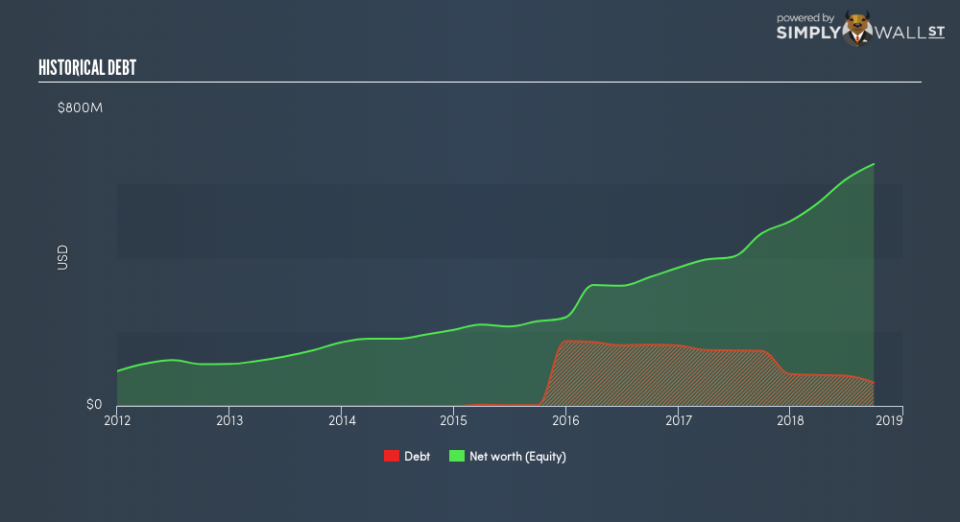
Over the past year, STMP has reduced its debt from US$148m to US$63m , which is made up of current and long term debt. With this reduction in debt, STMP’s cash and short-term investments stands at US$78m , ready to deploy into the business. Moving onto cash from operations, its trivial cash flows from operations make the cash-to-debt ratio less useful to us, though these low levels of cash means that operational efficiency is worth a look. As the purpose of this article is a high-level overview, I won’t be looking at this today, but you can assess some of STMP’s operating efficiency ratios such as ROA here.
Can STMP pay its short-term liabilities?
At the current liabilities level of US$128m liabilities, it appears that the company has maintained a safe level of current assets to meet its obligations, with the current ratio last standing at 1.81x. Generally, for Online Retail companies, this is a reasonable ratio since there is a bit of a cash buffer without leaving too much capital in a low-return environment.
Can STMP service its debt comfortably?
With debt at 9.7% of equity, STMP may be thought of as having low leverage. STMP is not taking on too much debt commitment, which can be restrictive and risky for equity-holders. We can test if STMP’s debt levels are sustainable by measuring interest payments against earnings of a company. Ideally, earnings before interest and tax (EBIT) should cover net interest by at least three times. For STMP, the ratio of 76.2x suggests that interest is comfortably covered, which means that lenders may be inclined to lend more money to the company, as it is seen as safe in terms of payback.
Next Steps:
STMP’s low debt is also met with low coverage. This indicates room for improvement as its cash flow covers less than a quarter of its borrowings, which means its operating efficiency could be better. However, the company exhibits proper management of current assets and upcoming liabilities. This is only a rough assessment of financial health, and I’m sure STMP has company-specific issues impacting its capital structure decisions. I recommend you continue to research Stamps.com to get a more holistic view of the stock by looking at:
Future Outlook: What are well-informed industry analysts predicting for STMP’s future growth? Take a look at our free research report of analyst consensus for STMP’s outlook.
Valuation: What is STMP worth today? Is the stock undervalued, even when its growth outlook is factored into its intrinsic value? The intrinsic value infographic in our free research report helps visualize whether STMP is currently mispriced by the market.
Other High-Performing Stocks: Are there other stocks that provide better prospects with proven track records? Explore our free list of these great stocks here.
To help readers see past the short term volatility of the financial market, we aim to bring you a long-term focused research analysis purely driven by fundamental data. Note that our analysis does not factor in the latest price-sensitive company announcements.
The author is an independent contributor and at the time of publication had no position in the stocks mentioned. For errors that warrant correction please contact the editor at editorial-team@simplywallst.com.
