
 Yahoo Finance
 NASDAQ Traders Facing Challenge at 15567.50 – 15284.00
March E-mini NASDAQ-100 Index futures are under pressure late Thursday as a rebound in tech stocks faded. The slide in tech was poised to end a three-day rally. Technology shares have been volatile to start 2022 as the Federal Reserve has signaled it will fight inflation aggressively this year, including rate hikes and potentially reducing its balance sheet.
At 20:42 GMT, March E-mini NASDAQ-100 Index futures are trading 15547.25, down 340.00 or -2.14%. The Invesco QQQ Trust Series 1 is at $378.83, down $8.52 or -2.20%.
Weakness in Big Tech stocks, including Amazon and Microsoft, weighed on the NASDAQ. Shares of Snap dropped roughly 8%, while Virgin Galactic slid nearly 18% after the space exploration company announced a debt offering. Electric vehicle stock Tesla shed more than 5%.
Daily Swing Chart Technical Analysis
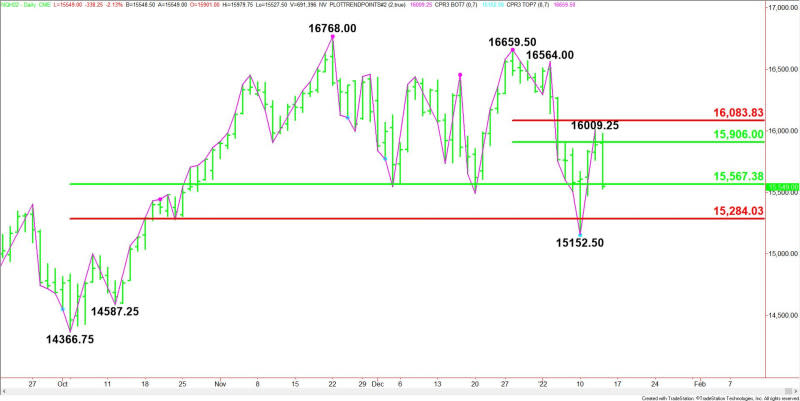
The main trend is down according to the daily swing chart. A trade through 15152.50 will signal a resumption of the downtrend. A move through 16564.00 will change the main trend to up.
The minor trend is down. A trade through 16009.25 will change the minor trend to up. This will shift momentum to the upside.
The short-term range is 16659.50 to 15152.50. Its retracement zone at 15906.00 to 16084.00 stopped the rally at 16009.25 on Wednesday. This suggests a potentially bearish secondary lower top may be forming.
The main range is 14366.75 to 16768.00. The index is currently testing its retracement zone at 15567.25 to 15284.00. This area is controlling the near-term direction of the index.
Near-Term Outlook
The near-term direction of the March E-mini NASDAQ-100 Index is likely to be determined by trader reaction to 15567.50 to 15284.00.
Bearish Outlook
A sustained move under the Fibonacci level at 15284.00 will indicate the presence of sellers. This could lead to a quick test of the main bottom at 15152.50. Taking out this level could trigger an acceleration to the downside with 14587.25 – 14366.75 the next target area.
Bullish Outlook
A sustained move over 15567.50 will signal the presence of buyers. If this move creates enough upside momentum then look for the rally to possibly extend into the short-term resistance zone at 15906.00 – 16084.00.
Taking out 16084.00 is a potential trigger point for an acceleration to the upside with the next major target 16564.00 – 16659.50.
For a look at all of today’s economic events, check out our economic calendar.
This article was originally posted on FX Empire
