
 Yahoo Finance
 Is Newell Brands Inc.'s (NASDAQ:NWL) Balance Sheet Strong Enough To Weather A Storm?

Want to participate in a short research study? Help shape the future of investing tools and you could win a $250 gift card!
Small-caps and large-caps are wildly popular among investors; however, mid-cap stocks, such as Newell Brands Inc. (NASDAQ:NWL) with a market-capitalization of US$6.5b, rarely draw their attention. While they are less talked about as an investment category, mid-cap risk-adjusted returns have generally been better than more commonly focused stocks that fall into the small- or large-cap categories. This article will examine NWL’s financial liquidity and debt levels to get an idea of whether the company can deal with cyclical downturns and maintain funds to accommodate strategic spending for future growth. Remember this is a very top-level look that focuses exclusively on financial health, so I recommend a deeper analysis into NWL here.
Check out our latest analysis for Newell Brands
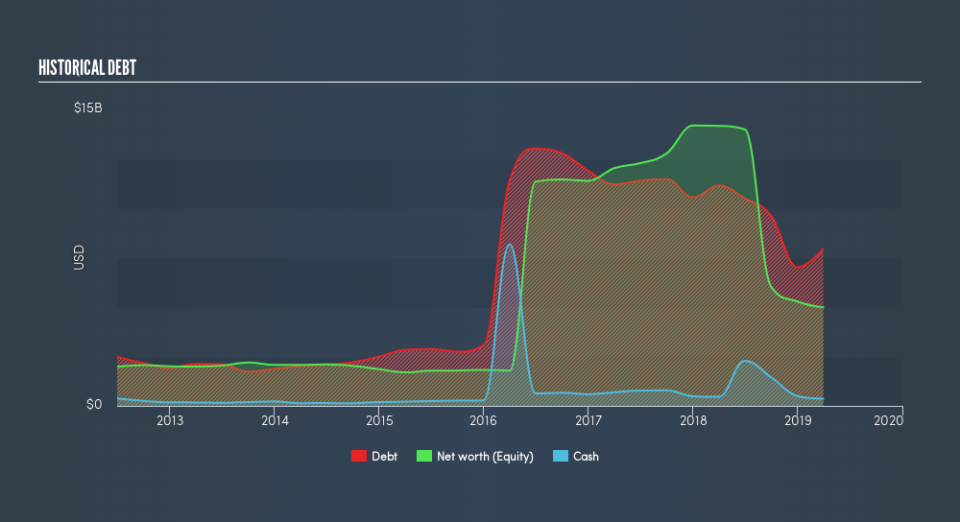
Does NWL Produce Much Cash Relative To Its Debt?
Over the past year, NWL has reduced its debt from US$11b to US$8.0b , which also accounts for long term debt. With this reduction in debt, NWL currently has US$364m remaining in cash and short-term investments , ready to be used for running the business. On top of this, NWL has produced US$881m in operating cash flow in the last twelve months, leading to an operating cash to total debt ratio of 11%, indicating that NWL’s current level of operating cash is not high enough to cover debt.
Does NWL’s liquid assets cover its short-term commitments?
Looking at NWL’s US$3.6b in current liabilities, it appears that the company has maintained a safe level of current assets to meet its obligations, with the current ratio last standing at 2.12x. The current ratio is calculated by dividing current assets by current liabilities. Usually, for Consumer Durables companies, this is a suitable ratio as there's enough of a cash buffer without holding too much capital in low return investments.
Is NWL’s debt level acceptable?
With total debt exceeding equity, NWL is considered a highly levered company. This is not uncommon for a mid-cap company given that debt tends to be lower-cost and at times, more accessible. Though, since NWL is currently loss-making, there’s a question of sustainability of its current operations. Running high debt, while not yet making money, can be risky in unexpected downturns as liquidity may dry up, making it hard to operate.
Next Steps:
Although NWL’s debt level is towards the higher end of the spectrum, its cash flow coverage seems adequate to meet obligations which means its debt is being efficiently utilised. Since there is also no concerns around NWL's liquidity needs, this may be its optimal capital structure for the time being. This is only a rough assessment of financial health, and I'm sure NWL has company-specific issues impacting its capital structure decisions. I suggest you continue to research Newell Brands to get a more holistic view of the mid-cap by looking at:
Future Outlook: What are well-informed industry analysts predicting for NWL’s future growth? Take a look at our free research report of analyst consensus for NWL’s outlook.
Valuation: What is NWL worth today? Is the stock undervalued, even when its growth outlook is factored into its intrinsic value? The intrinsic value infographic in our free research report helps visualize whether NWL is currently mispriced by the market.
Other High-Performing Stocks: Are there other stocks that provide better prospects with proven track records? Explore our free list of these great stocks here.
We aim to bring you long-term focused research analysis driven by fundamental data. Note that our analysis may not factor in the latest price-sensitive company announcements or qualitative material.
If you spot an error that warrants correction, please contact the editor at editorial-team@simplywallst.com. This article by Simply Wall St is general in nature. It does not constitute a recommendation to buy or sell any stock, and does not take account of your objectives, or your financial situation. Simply Wall St has no position in the stocks mentioned. Thank you for reading.
