
 Yahoo Finance
 NZD/USD Forex Technical Analysis – July 2, 2019 Forecast
The New Zealand Dollar closed sharply lower on Monday after posting a dramatic outside move closing price reversal top. Everything came into play on the move. Firstly, the currency was testing a major 50% to 61.8% retracement zone and secondly, it was in the midst of a prolonged move in terms of price and time, which put it in the window of time for the chart pattern. If confirmed, we should see a minimum 2 to 3 session break equal to 50% to 61.8% of the last rally.
At 01:00 GMT, the NZD/USD is trading .6673, down 0.0003 or -0.05%.
The catalyst for the reversal was a rise in U.S. Treasury yields, which made the U.S. Dollar a more attractive investment. Furthermore, some traders are saying that the decision to restart trade talks between the United States and China may give the U.S. Federal Reserve an excuse not to cut its benchmark interest rate in late July.
Daily Technical Analysis
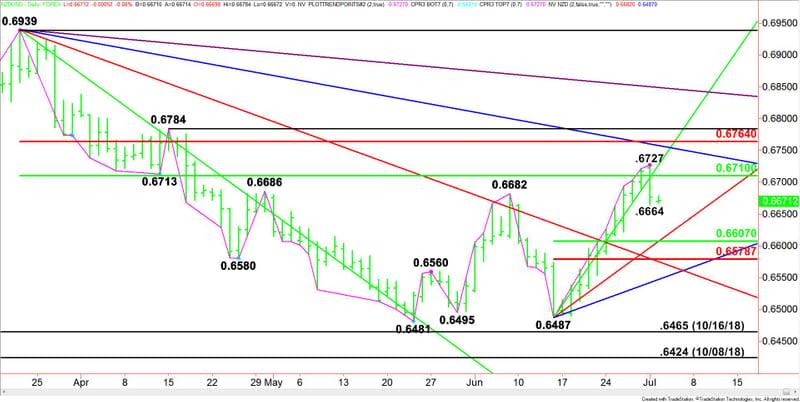
The main trend is up according to the daily swing chart. However, the closing price reversal top has put the NZD/USD in a position to shift momentum to the downside.
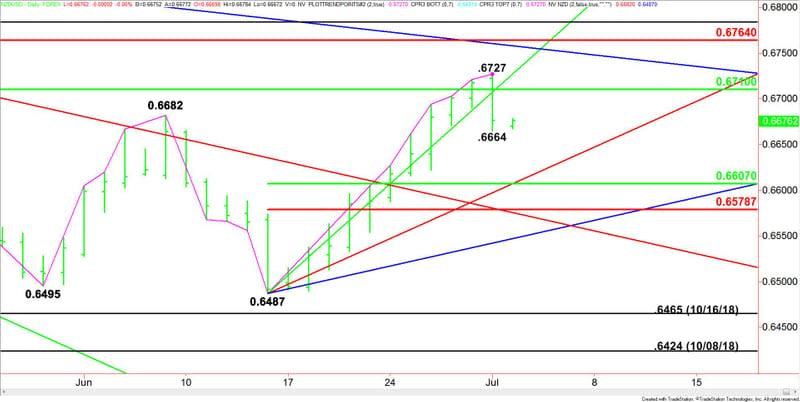
A trade through .6727 will negate the closing price reversal top and signal a resumption of the uptrend.
A move through .6664 will confirm the closing price reversal top and shift momentum to the downside.
The main range is .6939 to .6481. Its retracement zone at .6710 to .6764 stopped the rally on Monday. This zone is still resistance and it’s also controlling the longer-term direction of the Forex pair.
The minor range is .6487 to .6727. If the closing price reversal top is confirmed on the trade through .6664 then look for a 2 to 3 day break into its retracement zone at .6607 to .6579.
Daily Technical Forecast
Based on yesterday’s close at .6676 and the early price action, the direction of the NZD/USD on Tuesday will likely be determined by trader reaction to .6664.
Bullish Scenario
A sustained move over .6664 will indicate the return of buyers. This could trigger a retracement back to .6696. Remember that the first break from a top is usually long liquidation so a market often rallies the next day in order to bring in the short-sellers. This is what we may see on a pullback into .6696. Additional resistance is the main 50% level at .6710, followed by the reversal top at .6727.
Bearish Scenario
Taking out .6664 will confirm the reversal top. If the move attracts enough sellers to extend the move then look for a break into a Gann Angle/50% level price cluster at .6607. Buyers are likely to show up on a test of this area. If it fails as support then look for the selling to extend into the Fibonacci level at .6579.
This article was originally posted on FX Empire
