
 Yahoo Finance
 NZD/USD Forex Technical Analysis – Trend Down, but Momentum Up After Closing Price Reversal Bottom
The New Zealand Dollar finished higher on Friday after following through to the upside and confirming the previous session’s potentially bullish closing price reversal bottom. The rally doesn’t mean the trend is changing. It also doesn’t indicate a change in policy by the Reserve Bank of New Zealand. It is most likely position-squaring and short-covering related to weaker-than-expected U.S. economic data, which could be an indication of a slowing economy.
On Friday, the NZD/USD settled at .6551, up 0.0029 or +0.44%.
Daily Swing Chart Technical Analysis
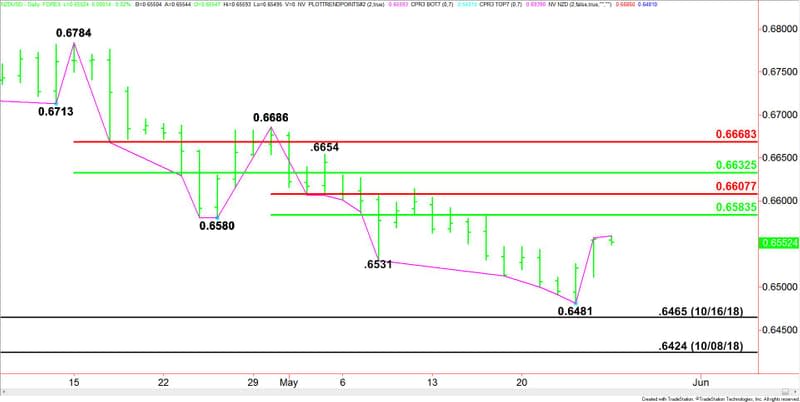
The main trend is down according to the daily swing chart, however, momentum shifted to the upside following the May 23 closing price reversal bottom at .6481 and the subsequent confirmation of the chart pattern on May 24.
The main trend doesn’t officially change to trend until the .6686 main top is taken out. A trade through .6481 will negate the chart pattern and signal a resumption of the downtrend. This is likely to lead to a test of the October 16, 2018 main bottom at .6465.
The short-term range is .6686 to .6481. Its retracement zone at .6584 to .6608 is the next upside target. Since the main trend is down, sellers are likely to come in on a test of this zone.
Daily Swing Chart Technical Forecast
Look for below average volume on Monday with a few of the major markets closed for a banking holiday. We’re not expending much of a range today.
If the upside momentum continues then look for a move into the short-term 50% level at .6584. If sellers come in to stop the follow-through move then look for a short-term retracement of the two day rally from .6481. Currently, that potential target is .6520.
This article was originally posted on FX Empire
