
 Yahoo Finance
 NZD/USD Forex Technical Analysis – Strengthens Over .6781, Weakens Under .6778
The New Zealand Dollar is trading higher early Wednesday in response to better-than-expected quarterly consumer inflation data. The rally was telegraphed on Tuesday after traders produced a potentially bullish closing price reversal bottom. Traders bought the Kiwi as the news brought relief to the Reserve Bank of New Zealand by dimming the chance of an interest rate cut.
At 0233 GMT, the NZD/USD is trading .6768, up 0.0020 or +0.31%.
Daily Swing Chart Technical Analysis
The main trend is up according to the daily swing chart. Momentum has also shifted to the upside with the formation of a closing price reversal bottom and the subsequent follow-through confirmation.
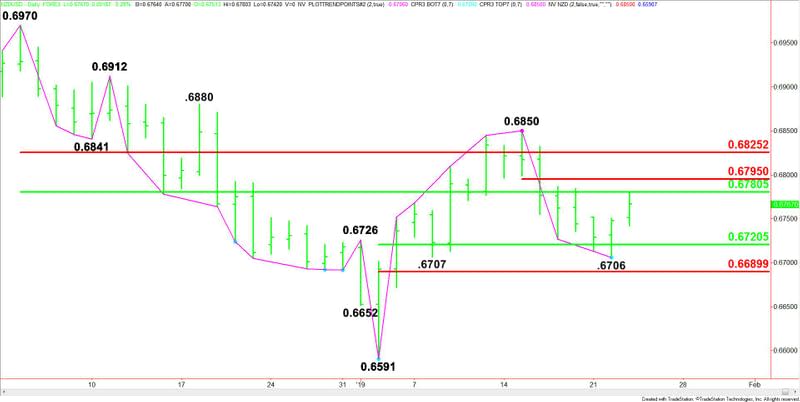
A trade through .6850 will signal a resumption of the uptrend. A move through .6706 will negate the closing price reversal bottom while shifting momentum to the downside.
The minor trend is down. Normally this means momentum is also down, but this was negated by the closing price reversal bottom. A trade through .6706 will reaffirm the minor downtrend and shift momentum back to the downside.
The major range is .6970 to .6591. Its retracement zone at .6781 to .6825 is controlling the near-term direction of the Forex pair.
The main range is .6591 to .6850. Its retracement zone at .6720 to .6690. This zone stopped the selling at .6706 on Tuesday.
The short-term range is .6850 to .6706. Its retracement zone at .6778 to .6795 is the first upside target.
Two 50% levels combine to form a resistance cluster at .6778 to .6781. Today’s intraday high is .6780. So this zone stopped the rally. Watch this area later in the day. Overtaking it will be a sign of strength.
Daily Swing Chart Technical Forecast
Based on the early price action, the direction of the NZD/USD the rest of the session is likely to be determined by trader reaction to the 50% resistance cluster at .6778 to .6781.
Bullish Scenario
A sustained move over .6781 will indicate the presence of buyers. This could trigger a quick rally into the short-term Fibonacci level at .6795. This is a potential trigger point for an acceleration to the upside with the next targets a major Fibonacci level at .6825 and a main top at .6850.
Bearish Scenario
A sustained move under .6778 will signal the presence of sellers. If this creates enough downside momentum then look for a possible break into the minor pivot at .6743. If this price fails then look for an extended break into the main 50% level at .6720 and the minor bottom at .6706.
This article was originally posted on FX Empire
