
 Yahoo Finance
 NZD/USD Forex Technical Analysis – Vulnerable to Steep Break if .6706 Fails
The New Zealand Dollar is trading a little better on Friday after early session selling pressure drove the currency to its lowest level since January 22. Yesterday’s steep sell-off was driven by stronger-than-expected U.S. economic data after a report showed weekly U.S. jobless benefits dropped to a 49-1/2 year low last week and the Producer Price Index jumped 0.6% in March, the largest rise since October.
At 03:56 GMT, the NZD/USD is at .6734, up 0.0007 or +0.09%.
Daily Swing Chart Technical Analysis
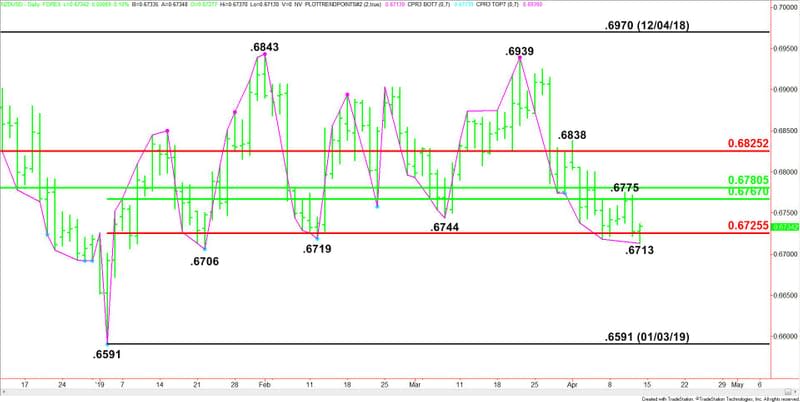
The main trend is down according to the daily swing chart. The downtrend was reaffirmed earlier in the session when sellers took out the February 12 bottom at .6719, before stopping at .6713. The next target is the January 22 main bottom at .6706. Look for a steep sell-off if this bottom fails.
The last main top was .6939 on March 21. The current 16 day sell-off has helped push the NZD/USD to the weak side of a pair of retracement zones. These retracement levels are new resistance at .6725, .6767, .6781 and .6825. The most important resistance area is .6767 to .6781.
Daily Swing Chart Technical Forecast
Due to the prolonged move down in terms of price and time, we have to be aware of a possible closing price reversal bottom. We’ve already seen a lower-low today so a higher close will indicate the selling is getting weaker, or the buying stronger. This chart pattern won’t change the main trend to up, but it could lead to a 2 to 3 day counter-trend rally, designed to alleviate some of the selling pressure.
Based on the early price action the direction of the NZD/USD is likely to be determined by trader reaction to yesterday’s close at .6727 and the Fibonacci level at .6725.
Bullish Scenario
A sustained move over .6727 will indicate the presence of buyers. This could trigger the start of a short-covering rally with the next potential targets a 50% level at .6767, a minor top at .6775 and a 50% level at .6781.
Bearish Scenario
A sustained move under .6725 will signal the presence of sellers. This will also put the NZD/USD in a position to form the potentially bearish closing price reversal top. The next target will be today’s intraday low at .6713. Taking out this level will likely lead to a test of the main bottom at .6706.
The daily chart is wide open under .6706 with the next major target the January 3 main bottom at .6591. Look for a potential acceleration to the downside if .6706 is taken out with conviction.
This article was originally posted on FX Empire
More From FXEMPIRE:
EUR/USD Daily Price Forecast – The Euro Pair At Its One-Month High
European Equities: A Fall in China Imports Will Test Sentiment ahead of Earnings
Natural Gas Price Prediction – Prices Drop Despite Lower than Expected Inventory Build
NEM’s XEM Technical Analysis – Support Levels in Play – 12/04/19
USD/JPY Forex Technical Analysis – Trend Changes to Up on Strong U.S. Economic Data
