
 Yahoo Finance
 NZD/USD Forex Technical Analysis – Testing Key Uptrending Gann Angles at .6661 and .6654
The New Zealand Dollar is under pressure early Thursday after the latest ANZ Outlook survey showed business confidence fell further in August.
“In August, ANZ Business Outlook Survey headline business confidence dropped a further 5 points to a net 50 percent of respondents reporting they expect general business conditions to deteriorate in the year ahead,” said ANZ chief economist Sharon Zollner.
“It is rare for this series to be negative. If this weakness is sustained, it will not bode well for GDP growth heading into the end of the year.”
Daily Technical Analysis
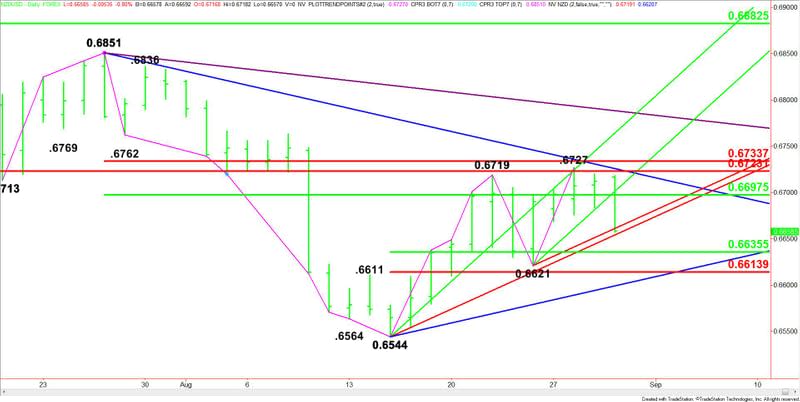
The main trend is up according to the daily swing chart, however, the lack of follow-through to the upside and trader reaction to a test of key retracement levels suggests that sellers may still be in control.
A trade through .6727 will signal a resumption of the uptrend. A move through .6621 will change the main trend to down.
The main range is .6851 to .6544. Its retracement zone at .6698 to .6734 is resistance. Inside this zone is a major Fibonacci level at .6723. This levels stopped the rally on Tuesday, helping to contribute to today’s weakness.
The short-term range is .6544 to .6727. If the selling pressure continues then look for the move to extend into its retracement zone at .6635 to .6614. Inside this retracement zone is the last main bottom at .6621.
Daily Technical Forecast
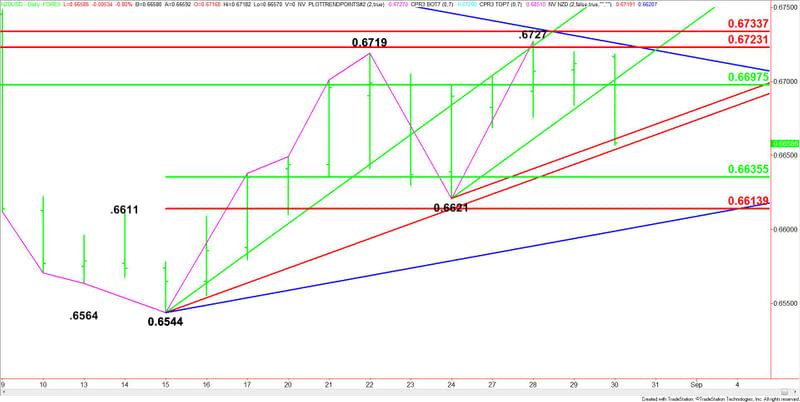
Based on the early price action and the current price at .6664, the direction of the NZD/USD throughout the day is likely to be determined by trader reaction to a pair of uptrending Gann angles at .6661 and .6654.
Holding at .6661 will signal the presence of buyers and that the worst of the selling is over. This could trigger an intraday short-covering rally with the best upside target the main 50% level at .6698.
A failure to hold .6654 will signal that the selling pressure is getting stronger. This could trigger a further decline into the short-term 50% level at .6635, followed by the main bottom at .6621 and the 61.8% level at .6614.
This article was originally posted on FX Empire
