
 Yahoo Finance
 NZD/USD Forex Technical Analysis – February 20, 2019 Forecast
The New Zealand Dollar is trading lower on Wednesday, following the release of a mixed Producer Inflation report. Quarterly PPI Input rose 1.6%, better than the 1.0% forecast. PPI Output came in at 0.8%, below the 1.1% forecast. The jump in prices paid by producers was driven by a 23 percent increase in the prices paid for electricity and gas. Most producers weren’t able to pass on the increased energy cost.
At 03:46 GMT, the NZD/USD is trading .6871, down 0.0013 or -0.19%.
Position-squaring ahead of Wednesday’s release of the January U.S. Federal Reserve Monetary Policy Minutes at 19:00 GMT also weighed on prices.
Daily Technical Analysis
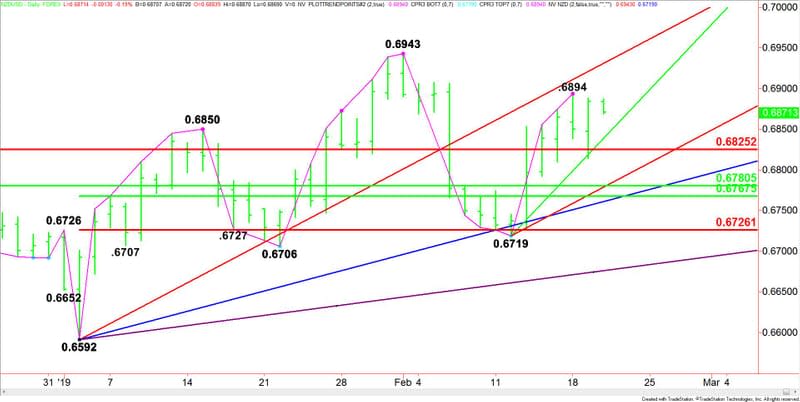
The main trend is up according to the daily swing chart. However, momentum is starting to show signs of slowing following the closing price reversal top at .6894 on February 18.
A trade through .6894 will negate the closing price reversal top and signal a resumption of the uptrend. The closing price reversal top doesn’t mean the trend is changing, but it could lead to a near-term correction. The actual trend changes to down on a trade through .6719.
The NZD/USD is also trading on the strong side of a major retracement zone at .6825 to .6780. This zone is controlling the longer-term direction of the Forex pair.
Daily Technical Forecast
Based on the recent price action, the direction of the NZD/USD the rest of today’s session will likely be determined by trader reaction to the reversal top at .6894.
Bullish Scenario
Taking out .6894 will signal the presence of buyers. If this creates enough upside momentum then look for a drive into the uptrending Gann angle at .6932. Overcoming the angle will put the NZD/USD in a bullish position. This could trigger an acceleration into the next main top at .6943.
Bearish Scenario
The inability to overcome .6894 and a sustained move under this level will signal the presence of sellers. The first downside target is an uptrending Gann angle at .6839. This angle held as support on Tuesday. If it fails then look for the selling to extend into the major Fibonacci level at .6825.
If .6825 fails as support then look for the selling to possibly extend into the support cluster at .6780 to .6779.
This article was originally posted on FX Empire
More From FXEMPIRE:
US Stocks Recover from Lackluster Session Amid Trump’s Flexibility on Trade Deadline
USD/CAD Daily Price Forecast – USD/CAD Continues Range Bound Action Amid Lack of Macro Data Updates
Cardano’s ADA Technical Analysis – Support Levels in Play – 20/02/19
EUR/USD Price Forecast – EURUSD to Trade Flat Ahead of Fed Meeting Minutes
