
 Yahoo Finance
 NZD/USD Forex Technical Analysis – September 19, 2018 Forecast
The New Zealand Dollar is trading higher on Wednesday, boosted by increased demand for higher risk assets after the new tariffs by the United States and China against each other turned out to be not as bad as investors initially feared.
In other news, the GDT Price Index fell 1.3%. The Current Account was worse than expected at -1.62B versus an estimate of -1.23B. The Westpac Consumer Sentiment was 103.5, down from 108.6.
At 0604 GMT, the NZD/USD is trading .6605, up 0.0019 or +0.29%.
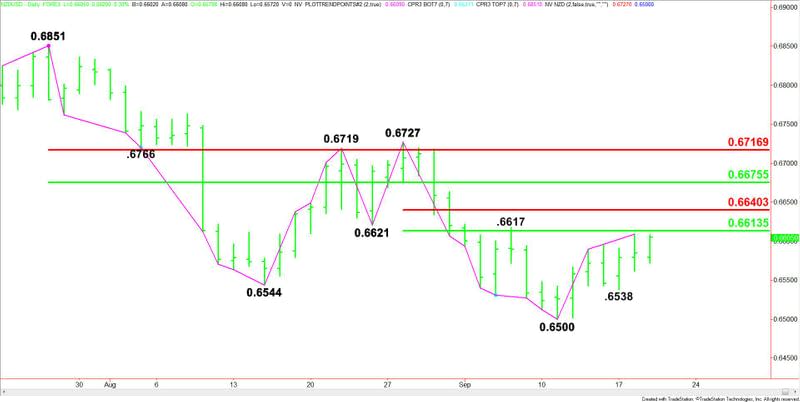
Daily Swing Chart Technical Analysis
The main trend is down according to the daily swing chart, however, momentum is trending higher. The main trend changes to up on a trade through .6727. A move through .6500 will change the main trend to down.
The minor trend is up. The minor trend changed to up on Tuesday. This move shifted momentum to the upside. A trade through .6617 will reaffirm the uptrend. A move through .6538 will change the minor trend to down and shift momentum back to the downside.
The short-term range is .6727 to .6500. Its retracement zone at .6614 to .6640 is the first upside target. Since the main trend is down, we may see sellers show up on the first test of this area. They are going to try to form a secondary lower top.
The main range is .6851 to .6500. Its retracement zone at .6676 to .6717 is the next upside objective.
Daily Swing Chart Technical Forecast
Based on the current price at .6605, the direction of the NZD/USD is likely to be determined by trader reaction to the 50% level at .6614.
A sustained move under .6614 will indicate the presence of sellers. This will also be an indication that sellers are defending the short-term retracement zone at .6614 to .6640.
If this move generates enough downside momentum then look for sellers to go after the minor bottom at .6538. Taking out this level will change the minor trend to down and shift momentum to the downside.
A sustained move over .6614 will signal the presence of buyers. Taking out .6617 will indicate the buying is getting stronger. This could create the upside momentum needed to challenge .6640.
This article was originally posted on FX Empire
More From FXEMPIRE:
AUD/USD Forex Technical Analysis – September 19, 2018 Forecast
Oil Price Fundamental Daily Forecast – API Report Reveals Surprise Inventories Build
EUR/USD Mid-Session Technical Analysis for September 19, 2018
GBP/USD Daily Price Forecast – GBP/USD Moves Range Bound Ahead of UK Inflation Data Update
