
 Yahoo Finance
 NZD/USD Forex Technical Analysis – Trade Through .6719 Will Change Weekly Trend to Down
Rising U.S. Treasury yields and weaker-than-expected domestic data weighed on the New Zealand Dollar last week. The price action suggests the selling is likely to continue early this week.
Treasury yields were driven sharply higher by stronger-than-expected U.S. Gross Domestic Product data, which helped raise the odds of at least one rate hike by the U.S. Federal Reserve later in the year. On the data front, New Zealand Retail Sales data beat the forecast, but the Trade Balance deficit came in much higher than expected.
For the week, the NZD/USD settled at .6799, down 0.0051 or -0.74%.
Weekly Technical Analysis
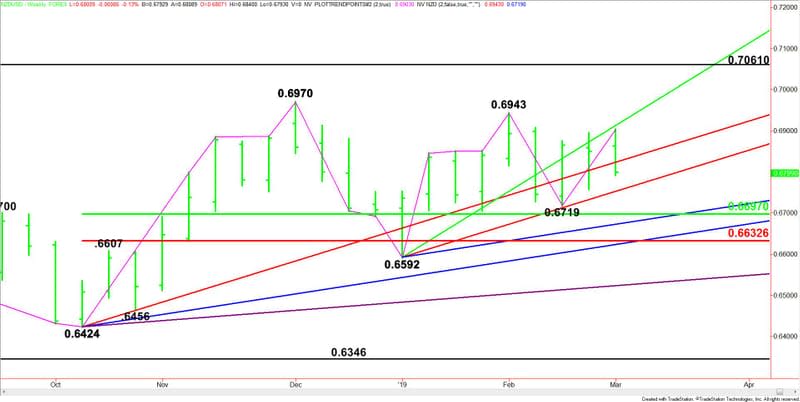
The main trend is up according to the weekly swing chart. However, momentum is trending lower. The formation of a secondary lower top at .6843 is one sign of the change in momentum.
A trade through .6943 will signal a resumption of the uptrend. This will also shift momentum to the upside. A move through .6719 will change the main trend to down.
The main range is .6424 to .6970. Its retracement zone at .6697 to .6633 is the primary downside target.
Weekly Technical Forecast
Based on last week’s price action and the close at .6799, the direction of the NZD/USD this week is likely to be determined by trader reaction to the uptrending Gann angle at .6844.
Bullish Scenario
A sustained move over .6844 will indicate the presence of buyers. If this move is able to generate enough upside momentum then look for a drive into the main top at .6943, followed closely by an uptrending Gann angle at .6952. Overtaking this Gann angle will put the Forex pair in a bullish position with the main top at .6970 the next likely upside target.
Bearish Scenario
A sustained move under .6844 will signal the presence of sellers. The first downside target is a short-term uptrending Gann angle at .6772. A move through this angle will indicate the selling is getting stronger.
Taking out .6772 could drive the NZD/USD through .6719, turning the main trend to down. This could lead to a test of the 50% level at .6697, followed closely by a short-term uptrending Gann angle at .6682. The next key support area is the Fibonacci level at .6633 and an uptrending Gann angle at .6634.
This article was originally posted on FX Empire
