
 Yahoo Finance
 NZD/USD Forex Technical Analysis – Buyers Not Chasing; Strengthens Over .7287, Weakens Under .7263
The New Zealand Dollar is trading lower on Thursday after giving up earlier gains. The Kiwi surged shortly after the opening as a dovish Fed opened the door to further upside action. A drop in Treasury yields late Wednesday was also supportive, but yields are now inching higher, making the U.S. Dollar a more attractive asset.
At 07:57 GMT, the NZD/USD is trading .7258, down 0.0005 or -0.07%.
On Wednesday, Federal Reserve officials reaffirmed their plan to keep interest rates and asset purchases steady even as the economic recovery gains steam.
Fed Chair Jerome Powell said in a press conference that it would be “some time” before there was substantial further progress in the economic recovery and that it was “not time yet” to begin discussing a change to the central bank’s asset purchase program.
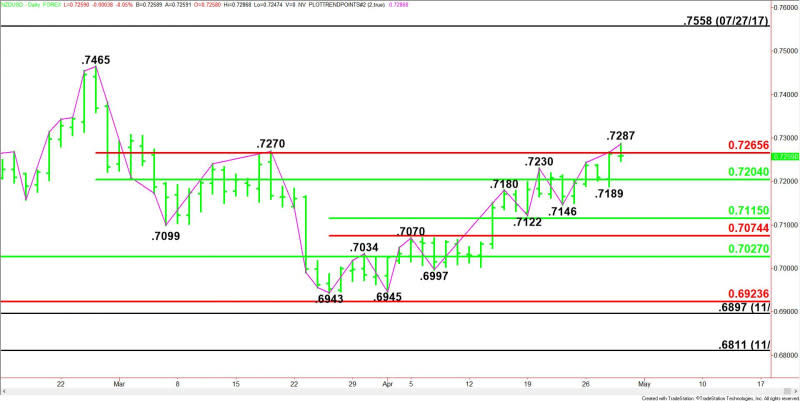
Daily Swing Chart Technical Analysis
The main trend is up according to the daily swing chart. The uptrend was reaffirmed earlier today when buyers took out the previous main top at .7270. A trade below .7146 will change the main trend to down.
The minor trend is also up. A trade through .7189 will change the minor trend to down. This will also shift momentum to the downside.
The main range is .7465 to .6943. The NZD/USD is currently trading trying to breakout to the upside of its retracement zone at .7266 to .7204.
The short-term range is .6943 to .7287. If the main trend changes to down then its retracement zone at .7115 to .7074 will become the primary downside target and potential support.
Daily Swing Chart Technical Forecast
The direction of the NZD/USD on Thursday is likely to be determined by trader reaction to .7263.
Bullish Scenario
A sustained move over .7263 will indicate the presence of buyers. Overcoming the Fibonacci level at .7266 will indicate the buying is getting stronger. This could create the upside momentum needed to overcome the intraday high at .7287.
The daily chart indicates there is plenty of room to rally so a breakout over .7287 could trigger an acceleration to the upside with the next major target coming in at .7465.
Bearish Scenario
A sustained move under .7263 will signal the presence of sellers. If this creates enough downside momentum then look for the selling to possibly extend into the 50% level at .7204, followed by the minor bottom at .7189.
Side Notes
A close under .7263 will form a closing price reversal top. If confirmed, this could trigger the start of a 2 to 3 day correction.
For a look at all of today’s economic events, check out our economic calendar.
This article was originally posted on FX Empire
More From FXEMPIRE:
GBP/USD Daily Forecast – U.S. Dollar Moves Lower As Fed Stays Dovish
Price of Gold Fundamental Daily Forecast – Rising Treasury Yields Controlling the Price Action
German Inflation Delivers EUR Support Ahead of U.S GDP and Jobless Claim Figures
Ethereum, Litecoin, and Ripple’s XRP – Daily Tech Analysis – April 29th, 2021
