
 Yahoo Finance
 NZD/USD Forex Technical Analysis – Sellers Targeting .6988 – .6945 Retracement Zone
The New Zealand Dollar was pressured on Friday despite strong bets for a Reserve Bank of New Zealand rate hike on October 6. The price action reflects a stronger U.S. Dollar that was driven higher on Friday by better-than-forecast U.S. retail sales data released on Thursday that backed expectations for a reduction of asset purchases by the Federal Reserve before the end of the year.
On Friday, the NZD/USD settled at .7034, down 0.0039 or -0.55%.
The Fed holds a two-day monetary policy meeting on September 21-22 and is expected to open discussions on reducing its monthly bond purchases, while tying any actual change to U.S. job growth in September and beyond.
Daily Swing Chart Technical Analysis
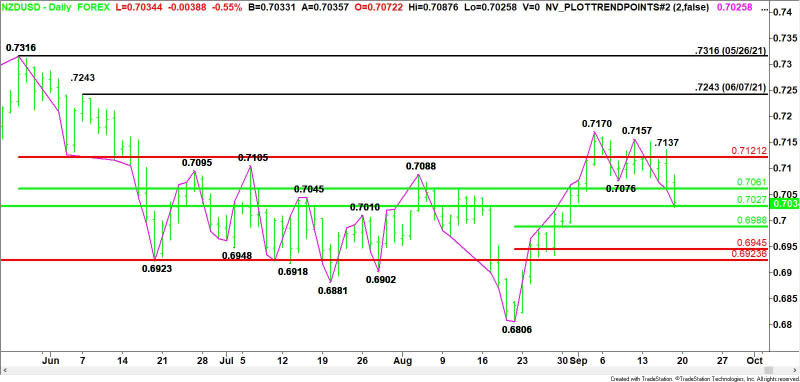
The main trend is down according to the daily swing chart. A trade through .7157 will change the main trend to up.
The minor trend is also down. A trade through .7137 will change the minor trend to up. This will also shift momentum to the upside.
The main range is .7316 to .6806. The NZD/USD is currently trading on the weak side of its retracement zone at .7061 to .7121, making this area resistance.
The long-term support zone is .7027 to .6924. The NZD/USD is currently testing the upper or 50% level of this zone.
The minor range is .6806 to .7170. Its retracement zone at .6988 to .6945 is the next target area. This zone falls inside the long-term zone.
Daily Swing Chart Technical Forecast
The direction of the NZD/USD early Monday is likely to be determined by trader reaction to the main 50% level at .7027.
Bullish Scenario
A sustained move over .7027 will indicate the presence of buyers. If this move creates enough upside momentum then look for a surge into the 50% level at .7061. Since the main trend is down, look for sellers on the first test. Overcoming this level will extend the rally.
Bearish Scenario
A sustained move under .7027 will signal the presence of sellers. If this move generates enough downside momentum then look for the selling to possibly extend into the retracement zone at .6988 to .6945.
For a look at all of today’s economic events, check out our economic calendar.
This article was originally posted on FX Empire
