NZD/USD Forex Technical Analysis – Testing Major Retracement Zone at .6710 to .6764
The New Zealand Dollar finished the week on a high note on Friday. The Forex pair has posted 10 consecutive higher closes. The main catalyst behind the rally is expectations of an interest rate cut by the Federal Reserve on July 31. The rally was initially sparked by traders pricing in a 50 basis point rate cut by the U.S. central bank. However, that idea was put to bed early last week after dovish comments from two Fed officials.
Nonetheless, the rally continued after the Reserve Bank of New Zealand voted to leave rates unchanged at its monetary policy meeting. Traders now expect the RBNZ to cut again in August, but the price action doesn’t indicate this.
Over the weekend, the U.S. and China agreed to renew trade talks. On paper this is bullish for commodity currencies. However, the direction of the New Zealand Dollar is more likely to be determined by how Treasury yields respond to the news. Higher yields in the U.S. tend to make the U.S. Dollar a more desirable asset.
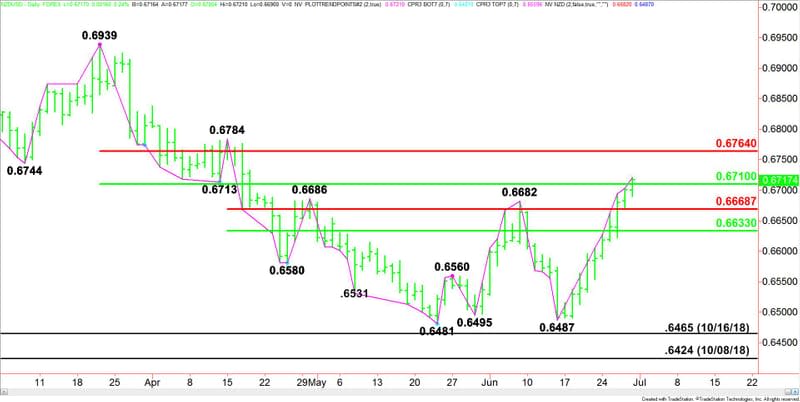
On Friday, the NZD/USD settled at .6717, up 0.0016 or +0.24%.

Daily Swing Chart Technical Analysis
The main trend is up according to the daily swing chart. The main trend turned up last week when buyers took out the .6682 swing top. The next main top target is .6784.
The main trend will change to down on a trade through .6487. This is unlikely, but the NZD/USD is inside the window of time for a closing price reversal top.
The main range is .6939 to .6481. Its retracement zone at .6710 to .6746 is the next upside target. This zone was tested on Friday. Trader reaction to this area should set the tone for the NZD/USD this week.
The intermediate range is .6784 to .6481. Its retracement zone at .6669 to .6633 is new support. If this fails then look for a 50% retracement of the 10 day rally.
Daily Swing Chart Technical Forecast
Based on Friday’s close at .6717, the direction of the NZD/USD on Monday is likely to be determined by trader reaction to the main 50% level at .6710.
Bullish Scenario
A sustained move over .6710 will indicate the presence of buyers. If this move generate enough upside momentum then look for the rally to continue into the main Fibonacci level at .6764. This is followed by the main top at .6784. This price is a potential trigger point for an acceleration to the upside.
Bearish Scenario
A sustained move under .6710 will signal the presence of sellers. The first downside target is the intermediate Fibonacci level at .6669. This is followed by the intermediate 50% level at .6633. This price level is the trigger point for an acceleration to the downside.
This article was originally posted on FX Empire

 Yahoo Finance