Owens Corning (OC) Q1 Earnings & Net Sales Beat, Margins Fall
Owens Corning OC reported mixed results for first-quarter 2023. Although quarterly earnings and net sales surpassed the Zacks Consensus Estimate, both metrics declined on a year-over-year basis.
Owens Corning's shares dropped 1.4% on Apr 26 after the earnings release.
Brian Chambers, OC’s board chair and chief executive officer, stated, “In the first quarter, each of our segments performed well relative to market conditions, especially our North American residential businesses, demonstrating the strength of our customer partnerships, the value of our product lines, and the power of our brand. In addition to driving strong financial performance in the near-term, we continue to make strategic investments that will expand our growth potential and enhance our earnings over the long-term.”
Inside the Headlines
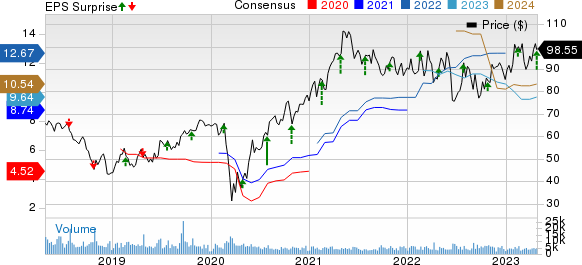
The company reported adjusted earnings of $2.77 per share, which topped the consensus mark of $2.20 by 25.9% but declined 5% from $2.92 a year ago.
Owens Corning Inc Price, Consensus and EPS Surprise

Owens Corning Inc price-consensus-eps-surprise-chart | Owens Corning Inc Quote
Net sales of $2.33 billion beat the consensus mark of $2.22 billion by 4.8% but fell 1% year over year.
Segment Details
Net sales in the Composites segment decreased 18% year over year to $585 million. This was due to lower volumes, including divestitures. Earnings before interest and taxes (EBIT) margin contracted to 8% from 22% in the year-ago period. EBITDA margins of 16% also declined from 28% reported a year ago. Reduced sales, the impact of production downtime and higher manufacturing costs hurt margins.
The Insulation segment’s net sales came in at $919 million, up 7% year over year on higher selling prices, partially offset by lower volumes. EBIT and EBITDA margins of 17% and 23% increased by 200 basis points (bps) each.
The Roofing segment’s net sales rose 7% year over year to $895 million, driven by higher selling prices and partially offset by lower sales volume. Both EBIT and EBITDA margins expanded by 200 bps to 23% and 25%, respectively. Higher selling prices were partially offset by cost inflation, primarily asphalt and other manufacturing costs and lower volumes.
Operating Highlights
Adjusted EBIT and adjusted EBITDA decreased 13% and 10%, respectively, on a year-over-year basis. Adjusted EBIT and adjusted EBITDA margin contracted 300 bps and 100 bps, respectively, from the year-ago figure.
Balance Sheet
As of Mar 31, 2023, the company had cash and cash equivalents of $757 million compared with $1,099 million at the 2022-end. Long-term debt — net of the current portion — totaled $3 billion, up from $2.99 billion at 2022-end.
In the first three months of 2023, net cash used in operating activities was $164 million versus net cash provided by operating activities of $158 million in the previous year. Free cash flow came in at negative $322 million for the reported period against $51 million a year ago.
In the first quarter, the company returned $183 million to shareholders through dividends and share repurchases. It raised dividends by 50% to 52 cents per share and repurchased 1.5 million shares of common stock.
Outlook
Owens Corning's businesses primarily depend on residential repair and remodeling activity, U.S. housing starts, global commercial construction activity and global industrial production. The company expects challenges in many of its end markets due to inflationary pressure, higher interest rates and continued geopolitical uncertainties.
For second-quarter, it expects a moderate decline in net sales from the prior-year period and EBIT margins in the mid-teens.
In 2023, general corporate expenses are expected to be between $195 million and $205 million. Capital additions are estimated at $520 million and depreciation and amortization are within $520-$530 million. Interest expenses are estimated between $95 million and $105 million. The company projects an effective tax rate of 24-26% and a cash tax rate of 26-28%, both on adjusted earnings.
Zacks Rank & Recent Construction Releases
Owens Corning currently carries a Zacks Rank #3 (Hold). You can see the complete list of today’s Zacks #1 Rank (Strong Buy) stocks here.
Masco Corporation MAS reported better-than-expected results for first-quarter 2023. The top and bottom lines surpassed the Zacks Consensus Estimate. The company has been benefiting from strong pricing actions and operational improvements.
On the other hand, adjusted earnings and net sales declined on a year-over-year basis due to supply-chain challenges and inflation headwinds.
Armstrong World Industries, Inc. AWI reported impressive results for first-quarter 2023, wherein earnings and net sales surpassed the Zacks Consensus Estimate and grew on a year-over-year basis.
The upside in AWI’s first quarter results was driven by double-digit sales and adjusted EBITDA growth in the Mineral Fiber segment.
PulteGroup Inc. PHM started 2023 on an impressive note. The company reported first-quarter 2023 results, wherein earnings and revenues surpassed the respective Zacks Consensus Estimate and increased year over year.
The company witnessed solid gross orders, closings and margins in the first quarter and posted a 28% increase in earnings per share (EPS) and a 12-month return on equity of 32%.
Want the latest recommendations from Zacks Investment Research? Today, you can download 7 Best Stocks for the Next 30 Days. Click to get this free report
Masco Corporation (MAS) : Free Stock Analysis Report
PulteGroup, Inc. (PHM) : Free Stock Analysis Report
Armstrong World Industries, Inc. (AWI) : Free Stock Analysis Report
Owens Corning Inc (OC) : Free Stock Analysis Report

 Yahoo Finance