
 Yahoo Finance
 Owens Corning (OC) Q4 Earnings Top, Stock Falls, Tepid Q1 View
Owens Corning OC reported impressive results for fourth-quarter 2022. Quarterly earnings and net sales surpassed the Zacks Consensus Estimate and increased on a year-over-year basis.
Despite lower volumes, high costs and unfavorable currency, strong pricing helped the company generate higher earnings.
Owens Corning's shares dropped 0.2% in the pre-market trading session on Feb 15, after the earnings release. Investors’ sentiment might have been hurt by tepid first-quarter 2023 net sales and EBIT guidance.
Looking forward, Brian Chambers, OC’s board chair and chief executive officer, stated, “While we anticipate our markets in 2023 will be more challenging, we remain focused on outperforming the market and delivering value for our shareholders.”
Inside the Headlines
The company reported adjusted earnings of $2.49 per share, which topped the consensus mark of $2.34 by 6.4% and increased 13% from $2.20 a year ago.
Owens Corning Inc Price, Consensus and EPS Surprise
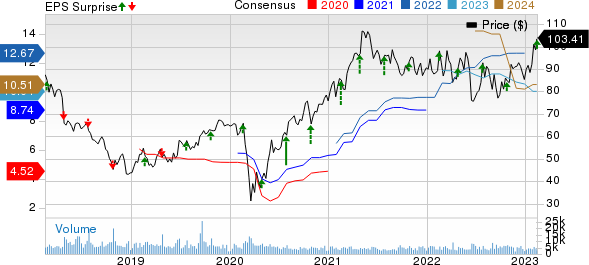
Owens Corning Inc price-consensus-eps-surprise-chart | Owens Corning Inc Quote
Net sales of $2.29 billion beat the consensus mark of $2.26 billion by 1.1% and increased 7% year over year. The uptick was mainly backed by the strength of the Insulation and Roofing businesses.
Segment Details
Net sales in the Composites segment decreased 3% year over year to $589 million. This was due to lower volumes and unfavorable currency translation, which were partially offset by higher selling prices. Earnings before interest and taxes (EBIT) margin of 11% contracted by 500 basis points (bps) from the year-ago quarter’s levels. Input cost inflation, reduced sales and the impact of production downtime and other manufacturing costs hurt margins.
The Insulation segment’s net sales came in at $956 million, up 11% year over year on higher selling prices and the acquisition of Natural Polymers, partially offset by lower volumes and unfavorable currency translation. EBIT increased to $153 million and the EBIT margin of 16% increased by 100 bps.
The Roofing segment’s net sales rose 12% year over year to $799 million, driven by higher selling prices and partially offset by lower sales volume. EBIT increased to $168 million. EBIT margin remained unchanged from the prior year at 21%. Higher selling prices were partially offset by cost inflation, primarily asphalt and other manufacturing costs and lower volumes.
Operating Highlights
Adjusted EBIT and adjusted EBITDA rose 2% each on a year-over-year basis. Adjusted EBIT margins remained flat from the year-ago figure of 15%, but adjusted EBITDA contracted 100 bps to 20%.
2022 Highlights
Adjusted earnings came in at $12.88 per share for the year, up 39% from 2021. Net sales were $9.76 billion, up 15% from the previous year. Adjusted EBIT and adjusted EBITDA rose 25% and 19% on a year-over-year basis, respectively. Both adjusted EBIT and adjusted EBITDA margins expanded by 100 bps.
Balance Sheet
As of Dec 31, 2022, the company had cash and cash equivalents of $1,099 million compared with $959 million at the 2021-end. Long-term debt — net of current portion — totaled $2.99 billion, up from $2.96 billion at 2021-end.
In 2022, net cash provided by operating activities was $1,760 million compared with $1,503 million in 2021. Free cash flow came in at $1,314 million for the year, up from $1,087 million a year ago.
In 2022, the company returned $931 million to shareholders through dividends and share repurchases. It paid dividends of $136 million and repurchased 9.2 million shares of common stock for $795 million. In December 2022, OC announced an additional share repurchase authorization for up to 10 million shares of its common stock. At the end of 2022, 14.4 million shares were available under the combined authorization.
Outlook
Owens Corning's businesses primarily depend on residential repair and remodeling activity, U.S. housing starts, global commercial construction activity and global industrial production.
The company expects challenges in many of its end markets due to inflationary pressure, higher interest rates and continued geopolitical uncertainties. For first-quarter 2023, it expects a moderate decline in net sales from the prior-year period and EBIT margins in the low- to mid-teens.
In 2023, general corporate expenses are expected to be between $195 million and $205 million. Capital additions are estimated at $520 million and depreciation and amortization within $520-$530 million. Interest expenses are estimated between $95 million and $105 million. The company projects an effective tax rate of 24-26% and a cash tax rate of 26-28%, both on adjusted earnings.
Zacks Rank & Recent Construction Releases
Owens Corning currently carries a Zacks Rank #4 (Sell). You can see the complete list of today’s Zacks #1 Rank (Strong Buy) stocks here.
United Rentals, Inc. URI reported fourth-quarter 2022 results. Its earnings and revenues missed the Zacks Consensus Estimate but increased on a year-over-year basis on the back of sustained demand in its end markets and the strength of its core rental business.
URI provided solid full-year 2023 guidance for total revenues and adjusted EBITDA, given broad-based end-market activity, contractor backlogs, customer sentiment and solid visibility. Also, it unveiled a quarterly dividend of $1.48 per share, with an annualized yield of approximately 1.5%. The company also plans to restart its share repurchase program, with the intention of buying back $1 billion of common stock in 2023.
Otis Worldwide Corporation OTIS reported solid fourth-quarter 2022 results. Its earnings and sales surpassed the Zacks Consensus Estimate. Its quarterly results reflected strong performance, including mid-single-digit organic sales growth in New Equipment and Service and continued operating profit margin expansion in the Service business.
Otis remains focused on strong portfolio growth and generating a solid New Equipment backlog. It also intends to expand operating margins, return cash to shareholders through a capital-allocation strategy and pursue additional progress toward ESG goals.
Masco Corporation MAS reported mixed results for fourth-quarter 2022. The bottom line lagged the Zacks Consensus Estimate and declined on a year-over-year basis due to supply-chain challenges and inflation headwinds.
Net sales surpassed the consensus mark but declined from the prior-year quarter’s level, thanks to demand softness across the product categories in North America, partially offset by selling price increases.
Want the latest recommendations from Zacks Investment Research? Today, you can download 7 Best Stocks for the Next 30 Days. Click to get this free report
Masco Corporation (MAS) : Free Stock Analysis Report
United Rentals, Inc. (URI) : Free Stock Analysis Report
Owens Corning Inc (OC) : Free Stock Analysis Report
Otis Worldwide Corporation (OTIS) : Free Stock Analysis Report
