
 Yahoo Finance
 The past five years for Standard BioTools (NASDAQ:LAB) investors has not been profitable
Standard BioTools Inc. (NASDAQ:LAB) shareholders will doubtless be very grateful to see the share price up 82% in the last quarter. But that doesn't change the fact that the returns over the last half decade have been disappointing. The share price has failed to impress anyone , down a sizable 69% during that time. So we're hesitant to put much weight behind the short term increase. Of course, this could be the start of a turnaround.
It's worthwhile assessing if the company's economics have been moving in lockstep with these underwhelming shareholder returns, or if there is some disparity between the two. So let's do just that.
View our latest analysis for Standard BioTools
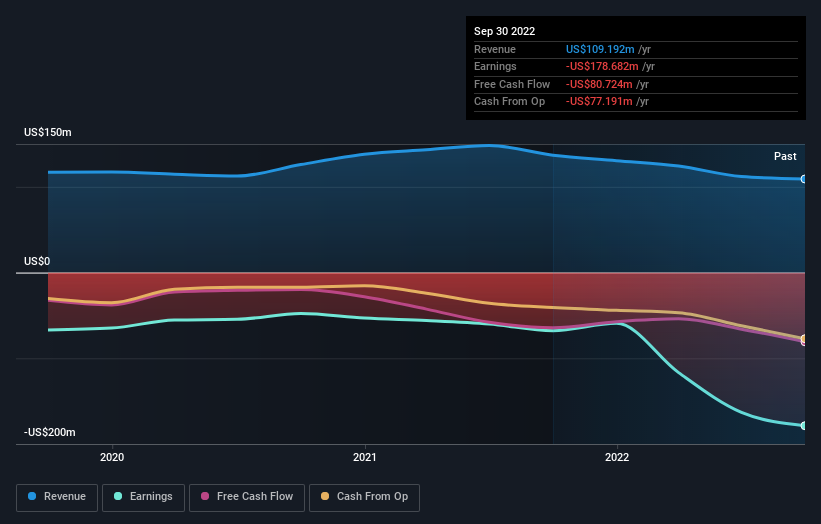
Because Standard BioTools made a loss in the last twelve months, we think the market is probably more focussed on revenue and revenue growth, at least for now. Generally speaking, companies without profits are expected to grow revenue every year, and at a good clip. As you can imagine, fast revenue growth, when maintained, often leads to fast profit growth.
Over five years, Standard BioTools grew its revenue at 4.7% per year. That's far from impressive given all the money it is losing. It's likely this weak growth has contributed to an annualised return of 11% for the last five years. We want to see an acceleration of revenue growth (or profits) before showing much interest in this one. However, it's possible too many in the market will ignore it, and there may be an opportunity if it starts to recover down the track.
The company's revenue and earnings (over time) are depicted in the image below (click to see the exact numbers).
Balance sheet strength is crucial. It might be well worthwhile taking a look at our free report on how its financial position has changed over time.
A Different Perspective
While the broader market lost about 7.0% in the twelve months, Standard BioTools shareholders did even worse, losing 38%. However, it could simply be that the share price has been impacted by broader market jitters. It might be worth keeping an eye on the fundamentals, in case there's a good opportunity. Regrettably, last year's performance caps off a bad run, with the shareholders facing a total loss of 11% per year over five years. Generally speaking long term share price weakness can be a bad sign, though contrarian investors might want to research the stock in hope of a turnaround. I find it very interesting to look at share price over the long term as a proxy for business performance. But to truly gain insight, we need to consider other information, too. Even so, be aware that Standard BioTools is showing 3 warning signs in our investment analysis , and 1 of those doesn't sit too well with us...
Of course Standard BioTools may not be the best stock to buy. So you may wish to see this free collection of growth stocks.
Please note, the market returns quoted in this article reflect the market weighted average returns of stocks that currently trade on US exchanges.
Have feedback on this article? Concerned about the content? Get in touch with us directly. Alternatively, email editorial-team (at) simplywallst.com.
This article by Simply Wall St is general in nature. We provide commentary based on historical data and analyst forecasts only using an unbiased methodology and our articles are not intended to be financial advice. It does not constitute a recommendation to buy or sell any stock, and does not take account of your objectives, or your financial situation. We aim to bring you long-term focused analysis driven by fundamental data. Note that our analysis may not factor in the latest price-sensitive company announcements or qualitative material. Simply Wall St has no position in any stocks mentioned.
Join A Paid User Research Session
You’ll receive a US$30 Amazon Gift card for 1 hour of your time while helping us build better investing tools for the individual investors like yourself. Sign up here
