
 Yahoo Finance
 The past five years for Transcontinental (TSE:TCL.A) investors has not been profitable
In order to justify the effort of selecting individual stocks, it's worth striving to beat the returns from a market index fund. But in any portfolio, there will be mixed results between individual stocks. So we wouldn't blame long term Transcontinental Inc. (TSE:TCL.A) shareholders for doubting their decision to hold, with the stock down 28% over a half decade. And it's not just long term holders hurting, because the stock is down 27% in the last year. Shareholders have had an even rougher run lately, with the share price down 18% in the last 90 days.
Since shareholders are down over the longer term, lets look at the underlying fundamentals over the that time and see if they've been consistent with returns.
See our latest analysis for Transcontinental
To quote Buffett, 'Ships will sail around the world but the Flat Earth Society will flourish. There will continue to be wide discrepancies between price and value in the marketplace...' One imperfect but simple way to consider how the market perception of a company has shifted is to compare the change in the earnings per share (EPS) with the share price movement.
During the five years over which the share price declined, Transcontinental's earnings per share (EPS) dropped by 6.6% each year. In this case, the EPS change is really very close to the share price drop of 6% a year. That suggests that the market sentiment around the company hasn't changed much over that time. So it's fair to say the share price has been responding to changes in EPS.
The image below shows how EPS has tracked over time (if you click on the image you can see greater detail).
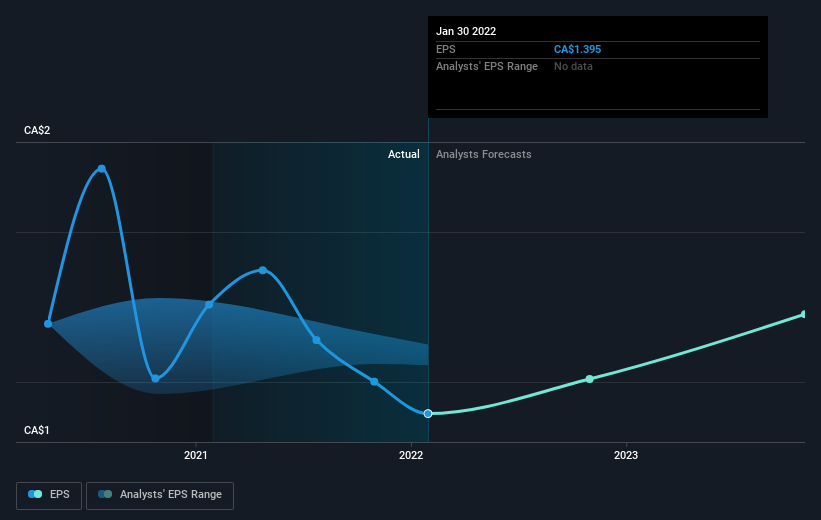
It's good to see that there was some significant insider buying in the last three months. That's a positive. That said, we think earnings and revenue growth trends are even more important factors to consider. Before buying or selling a stock, we always recommend a close examination of historic growth trends, available here..
What About Dividends?
As well as measuring the share price return, investors should also consider the total shareholder return (TSR). The TSR incorporates the value of any spin-offs or discounted capital raisings, along with any dividends, based on the assumption that the dividends are reinvested. It's fair to say that the TSR gives a more complete picture for stocks that pay a dividend. We note that for Transcontinental the TSR over the last 5 years was -9.4%, which is better than the share price return mentioned above. This is largely a result of its dividend payments!
A Different Perspective
Transcontinental shareholders are down 24% for the year (even including dividends), but the market itself is up 18%. However, keep in mind that even the best stocks will sometimes underperform the market over a twelve month period. Regrettably, last year's performance caps off a bad run, with the shareholders facing a total loss of 1.8% per year over five years. Generally speaking long term share price weakness can be a bad sign, though contrarian investors might want to research the stock in hope of a turnaround. It's always interesting to track share price performance over the longer term. But to understand Transcontinental better, we need to consider many other factors. Case in point: We've spotted 3 warning signs for Transcontinental you should be aware of.
If you like to buy stocks alongside management, then you might just love this free list of companies. (Hint: insiders have been buying them).
Please note, the market returns quoted in this article reflect the market weighted average returns of stocks that currently trade on CA exchanges.
Have feedback on this article? Concerned about the content? Get in touch with us directly. Alternatively, email editorial-team (at) simplywallst.com.
This article by Simply Wall St is general in nature. We provide commentary based on historical data and analyst forecasts only using an unbiased methodology and our articles are not intended to be financial advice. It does not constitute a recommendation to buy or sell any stock, and does not take account of your objectives, or your financial situation. We aim to bring you long-term focused analysis driven by fundamental data. Note that our analysis may not factor in the latest price-sensitive company announcements or qualitative material. Simply Wall St has no position in any stocks mentioned.
