
 Yahoo Finance
 The past year for Saietta Group (LON:SED) investors has not been profitable
The simplest way to benefit from a rising market is to buy an index fund. Active investors aim to buy stocks that vastly outperform the market - but in the process, they risk under-performance. That downside risk was realized by Saietta Group plc (LON:SED) shareholders over the last year, as the share price declined 27%. That falls noticeably short of the market decline of around 3.8%. We wouldn't rush to judgement on Saietta Group because we don't have a long term history to look at.
Now let's have a look at the company's fundamentals, and see if the long term shareholder return has matched the performance of the underlying business.
View our latest analysis for Saietta Group
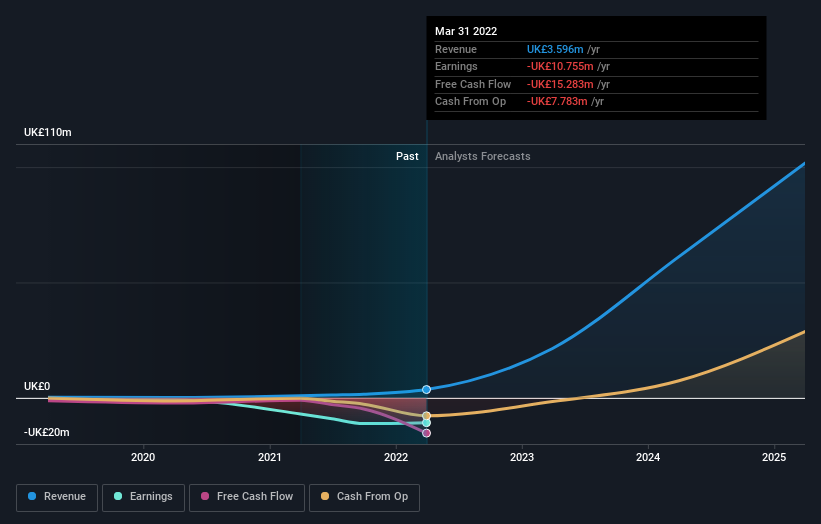
Because Saietta Group made a loss in the last twelve months, we think the market is probably more focussed on revenue and revenue growth, at least for now. Generally speaking, companies without profits are expected to grow revenue every year, and at a good clip. Some companies are willing to postpone profitability to grow revenue faster, but in that case one does expect good top-line growth.
In the last year Saietta Group saw its revenue grow by 313%. That's well above most other pre-profit companies. The share price drop of 27% over twelve months would be considered disappointing by many, so you might argue the company is getting little credit for its impressive revenue growth. Prima facie, revenue growth like that should be a good thing, so it's worth checking whether losses have stabilized. Our brains have evolved to think in linear fashion, so there's value in learning to recognize exponential growth. We are, in some ways, simply the wisest of the monkeys.
You can see how earnings and revenue have changed over time in the image below (click on the chart to see the exact values).
Take a more thorough look at Saietta Group's financial health with this free report on its balance sheet.
A Different Perspective
We doubt Saietta Group shareholders are happy with the loss of 27% over twelve months. That falls short of the market, which lost 3.8%. There's no doubt that's a disappointment, but the stock may well have fared better in a stronger market. The share price decline has continued throughout the most recent three months, down 4.8%, suggesting an absence of enthusiasm from investors. Basically, most investors should be wary of buying into a poor-performing stock, unless the business itself has clearly improved. It's always interesting to track share price performance over the longer term. But to understand Saietta Group better, we need to consider many other factors. For example, we've discovered 3 warning signs for Saietta Group (1 is significant!) that you should be aware of before investing here.
But note: Saietta Group may not be the best stock to buy. So take a peek at this free list of interesting companies with past earnings growth (and further growth forecast).
Please note, the market returns quoted in this article reflect the market weighted average returns of stocks that currently trade on GB exchanges.
Have feedback on this article? Concerned about the content? Get in touch with us directly. Alternatively, email editorial-team (at) simplywallst.com.
This article by Simply Wall St is general in nature. We provide commentary based on historical data and analyst forecasts only using an unbiased methodology and our articles are not intended to be financial advice. It does not constitute a recommendation to buy or sell any stock, and does not take account of your objectives, or your financial situation. We aim to bring you long-term focused analysis driven by fundamental data. Note that our analysis may not factor in the latest price-sensitive company announcements or qualitative material. Simply Wall St has no position in any stocks mentioned.
Join A Paid User Research Session
You’ll receive a US$30 Amazon Gift card for 1 hour of your time while helping us build better investing tools for the individual investors like yourself. Sign up here
