
 Yahoo Finance
 The past three years for Andrew Peller (TSE:ADW.A) investors has not been profitable
Investing in stocks inevitably means buying into some companies that perform poorly. Long term Andrew Peller Limited (TSE:ADW.A) shareholders know that all too well, since the share price is down considerably over three years. Sadly for them, the share price is down 59% in that time. And over the last year the share price fell 38%, so we doubt many shareholders are delighted. The falls have accelerated recently, with the share price down 18% in the last three months. But this could be related to the weak market, which is down 14% in the same period.
Now let's have a look at the company's fundamentals, and see if the long term shareholder return has matched the performance of the underlying business.
See our latest analysis for Andrew Peller
While the efficient markets hypothesis continues to be taught by some, it has been proven that markets are over-reactive dynamic systems, and investors are not always rational. One flawed but reasonable way to assess how sentiment around a company has changed is to compare the earnings per share (EPS) with the share price.
Andrew Peller saw its EPS decline at a compound rate of 17% per year, over the last three years. The share price decline of 26% is actually steeper than the EPS slippage. So it's likely that the EPS decline has disappointed the market, leaving investors hesitant to buy.
You can see below how EPS has changed over time (discover the exact values by clicking on the image).
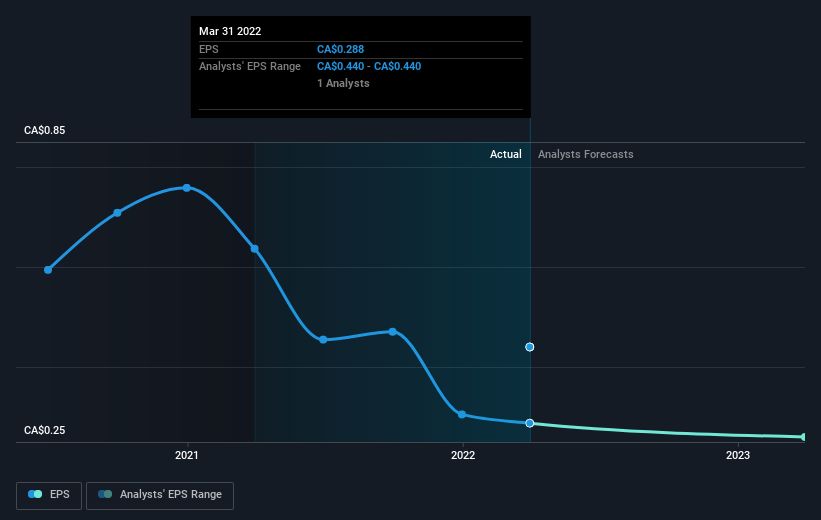
Dive deeper into Andrew Peller's key metrics by checking this interactive graph of Andrew Peller's earnings, revenue and cash flow.
What About Dividends?
It is important to consider the total shareholder return, as well as the share price return, for any given stock. Whereas the share price return only reflects the change in the share price, the TSR includes the value of dividends (assuming they were reinvested) and the benefit of any discounted capital raising or spin-off. So for companies that pay a generous dividend, the TSR is often a lot higher than the share price return. In the case of Andrew Peller, it has a TSR of -56% for the last 3 years. That exceeds its share price return that we previously mentioned. And there's no prize for guessing that the dividend payments largely explain the divergence!
A Different Perspective
While the broader market lost about 2.4% in the twelve months, Andrew Peller shareholders did even worse, losing 36% (even including dividends). Having said that, it's inevitable that some stocks will be oversold in a falling market. The key is to keep your eyes on the fundamental developments. Unfortunately, last year's performance may indicate unresolved challenges, given that it was worse than the annualised loss of 7% over the last half decade. Generally speaking long term share price weakness can be a bad sign, though contrarian investors might want to research the stock in hope of a turnaround. While it is well worth considering the different impacts that market conditions can have on the share price, there are other factors that are even more important. For instance, we've identified 6 warning signs for Andrew Peller (2 are a bit concerning) that you should be aware of.
If you like to buy stocks alongside management, then you might just love this free list of companies. (Hint: insiders have been buying them).
Please note, the market returns quoted in this article reflect the market weighted average returns of stocks that currently trade on CA exchanges.
Have feedback on this article? Concerned about the content? Get in touch with us directly. Alternatively, email editorial-team (at) simplywallst.com.
This article by Simply Wall St is general in nature. We provide commentary based on historical data and analyst forecasts only using an unbiased methodology and our articles are not intended to be financial advice. It does not constitute a recommendation to buy or sell any stock, and does not take account of your objectives, or your financial situation. We aim to bring you long-term focused analysis driven by fundamental data. Note that our analysis may not factor in the latest price-sensitive company announcements or qualitative material. Simply Wall St has no position in any stocks mentioned.
