
 Yahoo Finance
 PaySauce Limited's (NZSE:PYS) Stock Been Rising: Are Strong Financials Guiding The Market?
Most readers would already know that PaySauce's (NZSE:PYS) stock increased by 8.3% over the past three months. Given its impressive performance, we decided to study the company's key financial indicators as a company's long-term fundamentals usually dictate market outcomes. In this article, we decided to focus on PaySauce's ROE.
Return on Equity or ROE is a test of how effectively a company is growing its value and managing investors’ money. In short, ROE shows the profit each dollar generates with respect to its shareholder investments.
See our latest analysis for PaySauce
How Is ROE Calculated?
Return on equity can be calculated by using the formula:
Return on Equity = Net Profit (from continuing operations) ÷ Shareholders' Equity
So, based on the above formula, the ROE for PaySauce is:
40% = NZ$1.2m ÷ NZ$3.0m (Based on the trailing twelve months to March 2024).
The 'return' is the yearly profit. That means that for every NZ$1 worth of shareholders' equity, the company generated NZ$0.40 in profit.
What Is The Relationship Between ROE And Earnings Growth?
So far, we've learned that ROE is a measure of a company's profitability. Based on how much of its profits the company chooses to reinvest or "retain", we are then able to evaluate a company's future ability to generate profits. Generally speaking, other things being equal, firms with a high return on equity and profit retention, have a higher growth rate than firms that don’t share these attributes.
A Side By Side comparison of PaySauce's Earnings Growth And 40% ROE
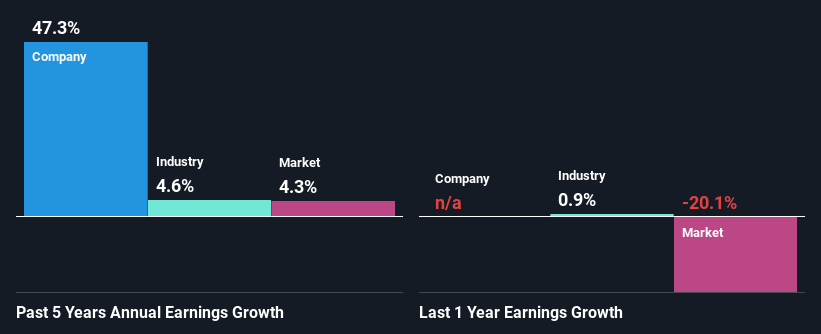
To begin with, PaySauce has a pretty high ROE which is interesting. Secondly, even when compared to the industry average of 13% the company's ROE is quite impressive. Under the circumstances, PaySauce's considerable five year net income growth of 47% was to be expected.
As a next step, we compared PaySauce's net income growth with the industry, and pleasingly, we found that the growth seen by the company is higher than the average industry growth of 4.6%.
The basis for attaching value to a company is, to a great extent, tied to its earnings growth. What investors need to determine next is if the expected earnings growth, or the lack of it, is already built into the share price. Doing so will help them establish if the stock's future looks promising or ominous. One good indicator of expected earnings growth is the P/E ratio which determines the price the market is willing to pay for a stock based on its earnings prospects. So, you may want to check if PaySauce is trading on a high P/E or a low P/E, relative to its industry.
Is PaySauce Making Efficient Use Of Its Profits?
PaySauce doesn't pay any regular dividends to its shareholders, meaning that the company has been reinvesting all of its profits into the business. This is likely what's driving the high earnings growth number discussed above.
Conclusion
On the whole, we feel that PaySauce's performance has been quite good. Particularly, we like that the company is reinvesting heavily into its business, and at a high rate of return. Unsurprisingly, this has led to an impressive earnings growth. If the company continues to grow its earnings the way it has, that could have a positive impact on its share price given how earnings per share influence long-term share prices. Let's not forget, business risk is also one of the factors that affects the price of the stock. So this is also an important area that investors need to pay attention to before making a decision on any business. To know the 4 risks we have identified for PaySauce visit our risks dashboard for free.
Have feedback on this article? Concerned about the content? Get in touch with us directly. Alternatively, email editorial-team (at) simplywallst.com.
This article by Simply Wall St is general in nature. We provide commentary based on historical data and analyst forecasts only using an unbiased methodology and our articles are not intended to be financial advice. It does not constitute a recommendation to buy or sell any stock, and does not take account of your objectives, or your financial situation. We aim to bring you long-term focused analysis driven by fundamental data. Note that our analysis may not factor in the latest price-sensitive company announcements or qualitative material. Simply Wall St has no position in any stocks mentioned.
