
 Yahoo Finance
 Is Pecca Group Berhad's (KLSE:PECCA) Stock's Recent Performance Being Led By Its Attractive Financial Prospects?
Most readers would already be aware that Pecca Group Berhad's (KLSE:PECCA) stock increased significantly by 6.6% over the past month. Given the company's impressive performance, we decided to study its financial indicators more closely as a company's financial health over the long-term usually dictates market outcomes. Specifically, we decided to study Pecca Group Berhad's ROE in this article.
Return on Equity or ROE is a test of how effectively a company is growing its value and managing investors’ money. In simpler terms, it measures the profitability of a company in relation to shareholder's equity.
Check out our latest analysis for Pecca Group Berhad
How Is ROE Calculated?
The formula for ROE is:
Return on Equity = Net Profit (from continuing operations) ÷ Shareholders' Equity
So, based on the above formula, the ROE for Pecca Group Berhad is:
16% = RM31m ÷ RM188m (Based on the trailing twelve months to September 2022).
The 'return' is the profit over the last twelve months. So, this means that for every MYR1 of its shareholder's investments, the company generates a profit of MYR0.16.
What Has ROE Got To Do With Earnings Growth?
We have already established that ROE serves as an efficient profit-generating gauge for a company's future earnings. Depending on how much of these profits the company reinvests or "retains", and how effectively it does so, we are then able to assess a company’s earnings growth potential. Generally speaking, other things being equal, firms with a high return on equity and profit retention, have a higher growth rate than firms that don’t share these attributes.
A Side By Side comparison of Pecca Group Berhad's Earnings Growth And 16% ROE
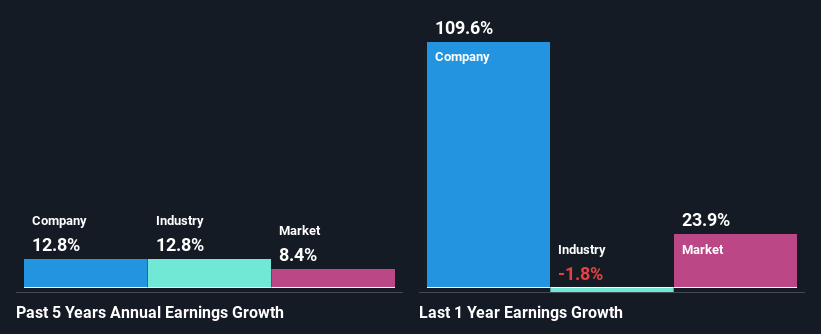
At first glance, Pecca Group Berhad seems to have a decent ROE. On comparing with the average industry ROE of 7.0% the company's ROE looks pretty remarkable. This certainly adds some context to Pecca Group Berhad's decent 13% net income growth seen over the past five years.
We then performed a comparison between Pecca Group Berhad's net income growth with the industry, which revealed that the company's growth is similar to the average industry growth of 13% in the same period.
The basis for attaching value to a company is, to a great extent, tied to its earnings growth. What investors need to determine next is if the expected earnings growth, or the lack of it, is already built into the share price. Doing so will help them establish if the stock's future looks promising or ominous. If you're wondering about Pecca Group Berhad's's valuation, check out this gauge of its price-to-earnings ratio, as compared to its industry.
Is Pecca Group Berhad Efficiently Re-investing Its Profits?
Pecca Group Berhad has a significant three-year median payout ratio of 62%, meaning that it is left with only 38% to reinvest into its business. This implies that the company has been able to achieve decent earnings growth despite returning most of its profits to shareholders.
Additionally, Pecca Group Berhad has paid dividends over a period of seven years which means that the company is pretty serious about sharing its profits with shareholders.
Summary
On the whole, we feel that Pecca Group Berhad's performance has been quite good. We are particularly impressed by the considerable earnings growth posted by the company, which was likely backed by its high ROE. While the company is paying out most of its earnings as dividends, it has been able to grow its earnings in spite of it, so that's probably a good sign. So far, we've only made a quick discussion around the company's earnings growth. You can do your own research on Pecca Group Berhad and see how it has performed in the past by looking at this FREE detailed graph of past earnings, revenue and cash flows.
Have feedback on this article? Concerned about the content? Get in touch with us directly. Alternatively, email editorial-team (at) simplywallst.com.
This article by Simply Wall St is general in nature. We provide commentary based on historical data and analyst forecasts only using an unbiased methodology and our articles are not intended to be financial advice. It does not constitute a recommendation to buy or sell any stock, and does not take account of your objectives, or your financial situation. We aim to bring you long-term focused analysis driven by fundamental data. Note that our analysis may not factor in the latest price-sensitive company announcements or qualitative material. Simply Wall St has no position in any stocks mentioned.
Join A Paid User Research Session
You’ll receive a US$30 Amazon Gift card for 1 hour of your time while helping us build better investing tools for the individual investors like yourself. Sign up here
