
 Yahoo Finance
 Do You Like Persimmon Plc (LON:PSN) At This P/E Ratio?

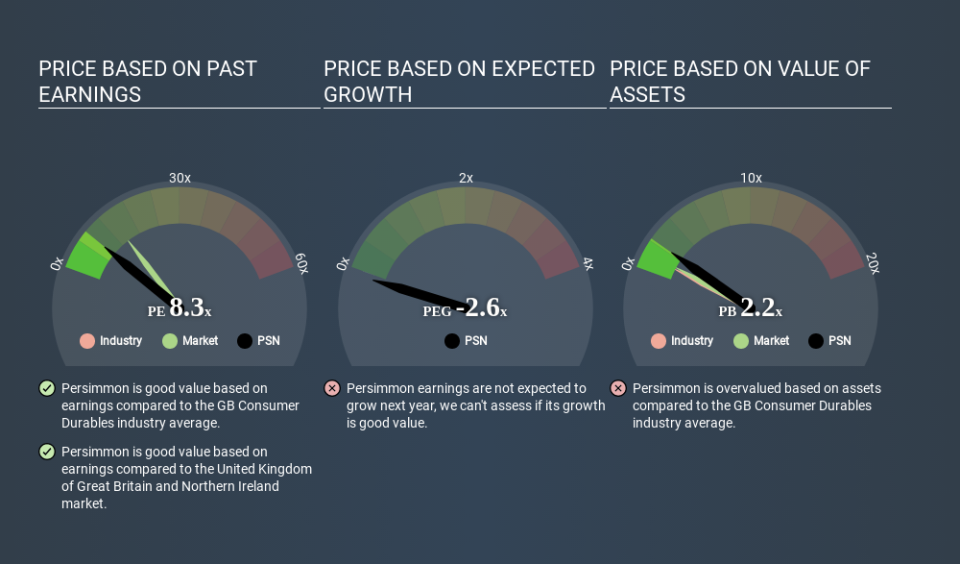
Today, we'll introduce the concept of the P/E ratio for those who are learning about investing. We'll show how you can use Persimmon Plc's (LON:PSN) P/E ratio to inform your assessment of the investment opportunity. Persimmon has a price to earnings ratio of 8.31, based on the last twelve months. That means that at current prices, buyers pay £8.31 for every £1 in trailing yearly profits.
See our latest analysis for Persimmon
How Do You Calculate A P/E Ratio?
The formula for price to earnings is:
Price to Earnings Ratio = Price per Share ÷ Earnings per Share (EPS)
Or for Persimmon:
P/E of 8.31 = £22.180 ÷ £2.668 (Based on the trailing twelve months to December 2019.)
(Note: the above calculation results may not be precise due to rounding.)
Is A High Price-to-Earnings Ratio Good?
A higher P/E ratio means that investors are paying a higher price for each £1 of company earnings. All else being equal, it's better to pay a low price -- but as Warren Buffett said, 'It's far better to buy a wonderful company at a fair price than a fair company at a wonderful price'.
How Does Persimmon's P/E Ratio Compare To Its Peers?
We can get an indication of market expectations by looking at the P/E ratio. As you can see below Persimmon has a P/E ratio that is fairly close for the average for the consumer durables industry, which is 8.6.
That indicates that the market expects Persimmon will perform roughly in line with other companies in its industry. The company could surprise by performing better than average, in the future. Further research into factors such as insider buying and selling, could help you form your own view on whether that is likely.
How Growth Rates Impact P/E Ratios
P/E ratios primarily reflect market expectations around earnings growth rates. Earnings growth means that in the future the 'E' will be higher. That means even if the current P/E is high, it will reduce over time if the share price stays flat. Then, a lower P/E should attract more buyers, pushing the share price up.
Persimmon saw earnings per share decrease by 5.8% last year. But over the longer term (5 years) earnings per share have increased by 17%.
A Limitation: P/E Ratios Ignore Debt and Cash In The Bank
The 'Price' in P/E reflects the market capitalization of the company. In other words, it does not consider any debt or cash that the company may have on the balance sheet. Hypothetically, a company could reduce its future P/E ratio by spending its cash (or taking on debt) to achieve higher earnings.
While growth expenditure doesn't always pay off, the point is that it is a good option to have; but one that the P/E ratio ignores.
How Does Persimmon's Debt Impact Its P/E Ratio?
With net cash of UK£844m, Persimmon has a very strong balance sheet, which may be important for its business. Having said that, at 12% of its market capitalization the cash hoard would contribute towards a higher P/E ratio.
The Verdict On Persimmon's P/E Ratio
Persimmon has a P/E of 8.3. That's below the average in the GB market, which is 14.1. Falling earnings per share are likely to be keeping potential buyers away, but the net cash position means the company has time to improve: if so, the low P/E could be an opportunity.
When the market is wrong about a stock, it gives savvy investors an opportunity. If the reality for a company is not as bad as the P/E ratio indicates, then the share price should increase as the market realizes this. So this free visualization of the analyst consensus on future earnings could help you make the right decision about whether to buy, sell, or hold.
You might be able to find a better buy than Persimmon. If you want a selection of possible winners, check out this free list of interesting companies that trade on a P/E below 20 (but have proven they can grow earnings).
If you spot an error that warrants correction, please contact the editor at editorial-team@simplywallst.com. This article by Simply Wall St is general in nature. It does not constitute a recommendation to buy or sell any stock, and does not take account of your objectives, or your financial situation. Simply Wall St has no position in the stocks mentioned.
We aim to bring you long-term focused research analysis driven by fundamental data. Note that our analysis may not factor in the latest price-sensitive company announcements or qualitative material. Thank you for reading.
