
 Yahoo Finance
 Pinning Down My E.G. Services Berhad's (KLSE:MYEG) P/E Is Difficult Right Now
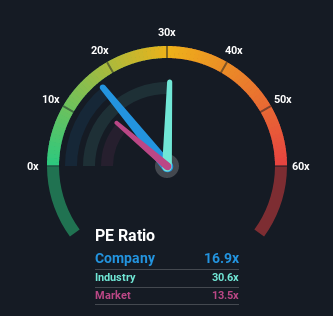
With a price-to-earnings (or "P/E") ratio of 16.9x My E.G. Services Berhad (KLSE:MYEG) may be sending bearish signals at the moment, given that almost half of all companies in Malaysia have P/E ratios under 13x and even P/E's lower than 7x are not unusual. However, the P/E might be high for a reason and it requires further investigation to determine if it's justified.
My E.G. Services Berhad certainly has been doing a good job lately as it's been growing earnings more than most other companies. It seems that many are expecting the strong earnings performance to persist, which has raised the P/E. If not, then existing shareholders might be a little nervous about the viability of the share price.
View our latest analysis for My E.G. Services Berhad
If you'd like to see what analysts are forecasting going forward, you should check out our free report on My E.G. Services Berhad.
Does Growth Match The High P/E?
The only time you'd be truly comfortable seeing a P/E as high as My E.G. Services Berhad's is when the company's growth is on track to outshine the market.
Retrospectively, the last year delivered an exceptional 26% gain to the company's bottom line. The latest three year period has also seen an excellent 62% overall rise in EPS, aided by its short-term performance. Accordingly, shareholders would have probably welcomed those medium-term rates of earnings growth.
Shifting to the future, estimates from the eight analysts covering the company suggest earnings should grow by 5.6% per year over the next three years. With the market predicted to deliver 8.8% growth per year, the company is positioned for a weaker earnings result.
In light of this, it's alarming that My E.G. Services Berhad's P/E sits above the majority of other companies. It seems most investors are hoping for a turnaround in the company's business prospects, but the analyst cohort is not so confident this will happen. Only the boldest would assume these prices are sustainable as this level of earnings growth is likely to weigh heavily on the share price eventually.
What We Can Learn From My E.G. Services Berhad's P/E?
Typically, we'd caution against reading too much into price-to-earnings ratios when settling on investment decisions, though it can reveal plenty about what other market participants think about the company.
Our examination of My E.G. Services Berhad's analyst forecasts revealed that its inferior earnings outlook isn't impacting its high P/E anywhere near as much as we would have predicted. When we see a weak earnings outlook with slower than market growth, we suspect the share price is at risk of declining, sending the high P/E lower. This places shareholders' investments at significant risk and potential investors in danger of paying an excessive premium.
It's always necessary to consider the ever-present spectre of investment risk. We've identified 1 warning sign with My E.G. Services Berhad, and understanding should be part of your investment process.
Of course, you might also be able to find a better stock than My E.G. Services Berhad. So you may wish to see this free collection of other companies that sit on P/E's below 20x and have grown earnings strongly.
Have feedback on this article? Concerned about the content? Get in touch with us directly. Alternatively, email editorial-team (at) simplywallst.com.
This article by Simply Wall St is general in nature. We provide commentary based on historical data and analyst forecasts only using an unbiased methodology and our articles are not intended to be financial advice. It does not constitute a recommendation to buy or sell any stock, and does not take account of your objectives, or your financial situation. We aim to bring you long-term focused analysis driven by fundamental data. Note that our analysis may not factor in the latest price-sensitive company announcements or qualitative material. Simply Wall St has no position in any stocks mentioned.
Join A Paid User Research Session
You’ll receive a US$30 Amazon Gift card for 1 hour of your time while helping us build better investing tools for the individual investors like yourself. Sign up here
