
 Yahoo Finance
 Are Poor Financial Prospects Dragging Down NZ Windfarms Limited (NZSE:NWF Stock?

With its stock down 7.0% over the past three months, it is easy to disregard NZ Windfarms (NZSE:NWF). To decide if this trend could continue, we decided to look at its weak fundamentals as they shape the long-term market trends. Particularly, we will be paying attention to NZ Windfarms' ROE today.
Return on Equity or ROE is a test of how effectively a company is growing its value and managing investors’ money. In other words, it is a profitability ratio which measures the rate of return on the capital provided by the company's shareholders.
Check out our latest analysis for NZ Windfarms
How Is ROE Calculated?
ROE can be calculated by using the formula:
Return on Equity = Net Profit (from continuing operations) ÷ Shareholders' Equity
So, based on the above formula, the ROE for NZ Windfarms is:
4.2% = NZ$1.7m ÷ NZ$41m (Based on the trailing twelve months to June 2020).
The 'return' is the yearly profit. One way to conceptualize this is that for each NZ$1 of shareholders' capital it has, the company made NZ$0.04 in profit.
What Has ROE Got To Do With Earnings Growth?
Thus far, we have learned that ROE measures how efficiently a company is generating its profits. We now need to evaluate how much profit the company reinvests or "retains" for future growth which then gives us an idea about the growth potential of the company. Assuming everything else remains unchanged, the higher the ROE and profit retention, the higher the growth rate of a company compared to companies that don't necessarily bear these characteristics.
A Side By Side comparison of NZ Windfarms' Earnings Growth And 4.2% ROE
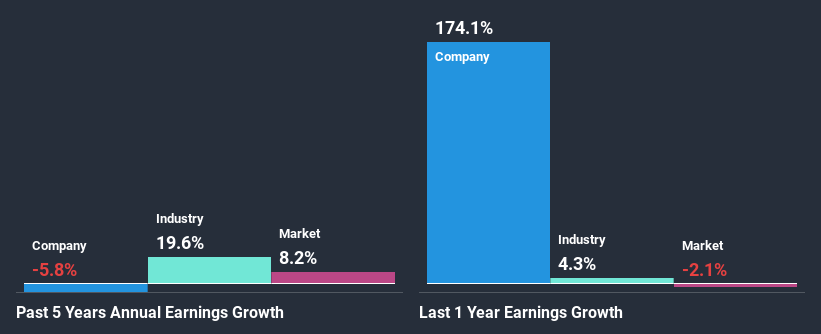
As you can see, NZ Windfarms' ROE looks pretty weak. However, the fact that it is higher than the industry average of 2.8% makes us a bit more interested. Or may be not, given NZ Windfarms' five year net income decline of 5.8% in the past five years. Remember, the company's ROE is quite low to begin with, just that it is higher than the industry average. Therefore, the decline in earnings could also be the result of this.
That being said, we compared NZ Windfarms' performance with the industry and were concerned when we found that while the company has shrunk its earnings, the industry has grown its earnings at a rate of 7.3% in the same period.
Earnings growth is a huge factor in stock valuation. What investors need to determine next is if the expected earnings growth, or the lack of it, is already built into the share price. By doing so, they will have an idea if the stock is headed into clear blue waters or if swampy waters await. Is NZ Windfarms fairly valued compared to other companies? These 3 valuation measures might help you decide.
Is NZ Windfarms Making Efficient Use Of Its Profits?
NZ Windfarms' high three-year median payout ratio of 187% suggests that the company is depleting its resources to keep up its dividend payments, and this shows in its shrinking earnings. Its usually very hard to sustain dividend payments that are higher than reported profits. Our risks dashboard should have the 3 risks we have identified for NZ Windfarms.
In addition, NZ Windfarms has been paying dividends over a period of three years suggesting that keeping up dividend payments is preferred by the management even though earnings have been in decline.
Summary
In total, we would have a hard think before deciding on any investment action concerning NZ Windfarms. Its earnings growth particularly is not much to talk about even though it does have a pretty respectable ROE. The lack of growth can be blamed on its poor earnings retention. As discussed earlier, the company is retaining hardly any of its profits. So far, we've only made a quick discussion around the company's earnings growth. You can do your own research on NZ Windfarms and see how it has performed in the past by looking at this FREE detailed graph of past earnings, revenue and cash flows.
This article by Simply Wall St is general in nature. It does not constitute a recommendation to buy or sell any stock, and does not take account of your objectives, or your financial situation. We aim to bring you long-term focused analysis driven by fundamental data. Note that our analysis may not factor in the latest price-sensitive company announcements or qualitative material. Simply Wall St has no position in any stocks mentioned.
Have feedback on this article? Concerned about the content? Get in touch with us directly. Alternatively, email editorial-team@simplywallst.com.
