
 Yahoo Finance
 Are Poor Financial Prospects Dragging Down Accordant Group Limited (NZSE:AGL Stock?
With its stock down 5.8% over the past week, it is easy to disregard Accordant Group (NZSE:AGL). We decided to study the company's financials to determine if the downtrend will continue as the long-term performance of a company usually dictates market outcomes. Particularly, we will be paying attention to Accordant Group's ROE today.
Return on equity or ROE is a key measure used to assess how efficiently a company's management is utilizing the company's capital. In short, ROE shows the profit each dollar generates with respect to its shareholder investments.
Check out our latest analysis for Accordant Group
How Do You Calculate Return On Equity?
Return on equity can be calculated by using the formula:
Return on Equity = Net Profit (from continuing operations) ÷ Shareholders' Equity
So, based on the above formula, the ROE for Accordant Group is:
8.2% = NZ$3.0m ÷ NZ$37m (Based on the trailing twelve months to March 2022).
The 'return' refers to a company's earnings over the last year. That means that for every NZ$1 worth of shareholders' equity, the company generated NZ$0.08 in profit.
What Is The Relationship Between ROE And Earnings Growth?
So far, we've learned that ROE is a measure of a company's profitability. Based on how much of its profits the company chooses to reinvest or "retain", we are then able to evaluate a company's future ability to generate profits. Assuming all else is equal, companies that have both a higher return on equity and higher profit retention are usually the ones that have a higher growth rate when compared to companies that don't have the same features.
Accordant Group's Earnings Growth And 8.2% ROE
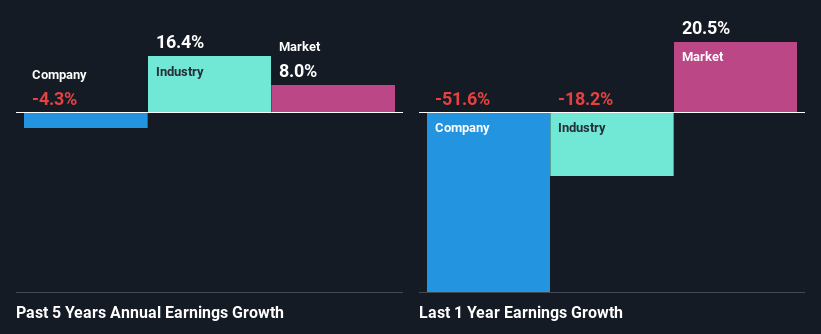
When you first look at it, Accordant Group's ROE doesn't look that attractive. A quick further study shows that the company's ROE doesn't compare favorably to the industry average of 11% either. Therefore, it might not be wrong to say that the five year net income decline of 4.3% seen by Accordant Group was probably the result of it having a lower ROE. We believe that there also might be other aspects that are negatively influencing the company's earnings prospects. For example, it is possible that the business has allocated capital poorly or that the company has a very high payout ratio.
So, as a next step, we compared Accordant Group's performance against the industry and were disappointed to discover that while the company has been shrinking its earnings, the industry has been growing its earnings at a rate of 11% in the same period.
Earnings growth is a huge factor in stock valuation. What investors need to determine next is if the expected earnings growth, or the lack of it, is already built into the share price. By doing so, they will have an idea if the stock is headed into clear blue waters or if swampy waters await. Is Accordant Group fairly valued compared to other companies? These 3 valuation measures might help you decide.
Is Accordant Group Using Its Retained Earnings Effectively?
With a three-year median payout ratio as high as 101%,Accordant Group's shrinking earnings don't come as a surprise as the company is paying a dividend which is beyond its means. Its usually very hard to sustain dividend payments that are higher than reported profits. To know the 4 risks we have identified for Accordant Group visit our risks dashboard for free.
Moreover, Accordant Group has been paying dividends for at least ten years or more suggesting that management must have perceived that the shareholders prefer dividends over earnings growth.
Summary
Overall, we would be extremely cautious before making any decision on Accordant Group. Specifically, it has shown quite an unsatisfactory performance as far as earnings growth is concerned, and a poor ROE and an equally poor rate of reinvestment seem to be the reason behind this inadequate performance. So far, we've only made a quick discussion around the company's earnings growth. To gain further insights into Accordant Group's past profit growth, check out this visualization of past earnings, revenue and cash flows.
Have feedback on this article? Concerned about the content? Get in touch with us directly. Alternatively, email editorial-team (at) simplywallst.com.
This article by Simply Wall St is general in nature. We provide commentary based on historical data and analyst forecasts only using an unbiased methodology and our articles are not intended to be financial advice. It does not constitute a recommendation to buy or sell any stock, and does not take account of your objectives, or your financial situation. We aim to bring you long-term focused analysis driven by fundamental data. Note that our analysis may not factor in the latest price-sensitive company announcements or qualitative material. Simply Wall St has no position in any stocks mentioned.
