
 Yahoo Finance
 Prudential (PRU) Q2 Earnings & Revenues Lag Estimates, Up Y/Y

Prudential Financial, Inc.’s PRU second-quarter 2018 operating net income of $3.01 per share missed the Zacks Consensus Estimate by 2.3%. The bottom line however, improved 44% year over year.
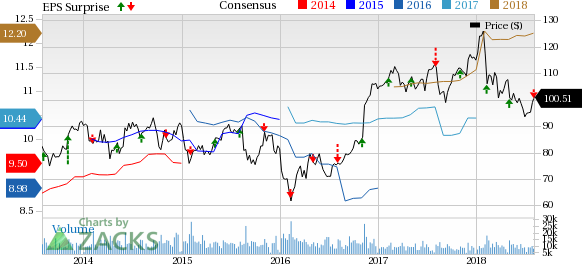
Prudential Financial, Inc. Price, Consensus and EPS Surprise
Prudential Financial, Inc. Price, Consensus and EPS Surprise | Prudential Financial, Inc. Quote
Stellar performances at International Insurance and improved results at PGIM drove this upside.
Behind the Headlines
Total revenues of $13 billion inched up 0.1% year over year as decrease in premiums was offset by higher policy charges and fee income, net investment income and asset management fees, commissions and other income. However, the top line lagged the Zacks Consensus Estimate by 8.1%.
Total benefits and expenses of nearly $11.3 billion declined 3.2% year over year in the quarter under review. This reduction in expenses is mainly attributable to lower insurance and annuity benefits, interest credited to policyholders, amortization of acquisition costs plus general and administrative expenses.
Quarterly Segment Update
PGIM — global investment management businesses — reported adjusted operating income of $254 million, up 16.5% year over year. This upside was owing to higher asset management fees, reflecting an increase in assets under management, primarily driven by fixed income net inflows and equity market appreciation. This in turn, is partially offset by rise in expenses.
PGIM assets under management were $1.156 trillion at quarter end.
U.S. Workplace Solutions adjusted operating income was $359 million, down 19.1% from the year-ago quarter on lower contribution from Retirement as well as Group Insurance segment.
International Insurance reported adjusted operating income of $550 million on the back of increased 10-fold year over year, largely because Individual Life segment returned to profitability and International Insurance delivered improved earnings.
Corporate and Other Operations reported adjusted operating loss of $286 million, narrower than $312 million incurred in the year-ago quarter.
Financial Update
Cash and cash equivalents of $14.9 billion at second-quarter end decreased 10.2% year over year.
As of Jun 30, 2018, Prudential Financial’s assets under management increased 4% to $1.39 trillion year over year. Adjusted book value, a measure of the company’s net worth, came in at $92.60 as of Jun 30, up 14.3% year over year.
Operating return on average equity was 13.5%.
Debt balance totaled $18.8 billion as of Jun 30, 2018, down from $19.4 billion as of Jun 30, 2017.
Prudential Financial deployed $760 million in share buybacks and dividends in the reported quarter.
Zacks Rank
Prudential Financial holds a Zacks Rank #2 (Buy). You can see the complete list of today’s Zacks #1 Rank (Strong Buy) stocks here.
Performance of Other Insurers
Among other firms from the insurance industry having reported second-quarter earnings so far, the bottom line of Radian Group Inc. RDN, The Hartford Financial Services Group, Inc. HIG and MGIC Investment Corporation MTG surpassed the respective Zacks Consensus Estimate.
Today's Stocks from Zacks' Hottest Strategies
It's hard to believe, even for us at Zacks. But while the market gained +21.9% in 2017, our top stock-picking screens have returned +115.0%, +109.3%, +104.9%, +98.6%, and +67.1%.
And this outperformance has not just been a recent phenomenon. Over the years it has been remarkably consistent. From 2000 - 2017, the composite yearly average gain for these strategies has beaten the market more than 19X over. Maybe even more remarkable is the fact that we're willing to share their latest stocks with you without cost or obligation.
See Them Free>>
Want the latest recommendations from Zacks Investment Research? Today, you can download 7 Best Stocks for the Next 30 Days. Click to get this free report
Radian Group Inc. (RDN) : Free Stock Analysis Report
The Hartford Financial Services Group, Inc. (HIG) : Free Stock Analysis Report
MGIC Investment Corporation (MTG) : Free Stock Analysis Report
Prudential Financial, Inc. (PRU) : Free Stock Analysis Report
To read this article on Zacks.com click here.
