
 Yahoo Finance
 Rakon (NZSE:RAK) Seems To Use Debt Rather Sparingly
David Iben put it well when he said, 'Volatility is not a risk we care about. What we care about is avoiding the permanent loss of capital.' So it seems the smart money knows that debt - which is usually involved in bankruptcies - is a very important factor, when you assess how risky a company is. As with many other companies Rakon Limited (NZSE:RAK) makes use of debt. But the more important question is: how much risk is that debt creating?
When Is Debt Dangerous?
Debt assists a business until the business has trouble paying it off, either with new capital or with free cash flow. Ultimately, if the company can't fulfill its legal obligations to repay debt, shareholders could walk away with nothing. However, a more frequent (but still costly) occurrence is where a company must issue shares at bargain-basement prices, permanently diluting shareholders, just to shore up its balance sheet. Of course, the upside of debt is that it often represents cheap capital, especially when it replaces dilution in a company with the ability to reinvest at high rates of return. When we think about a company's use of debt, we first look at cash and debt together.
View our latest analysis for Rakon
What Is Rakon's Net Debt?
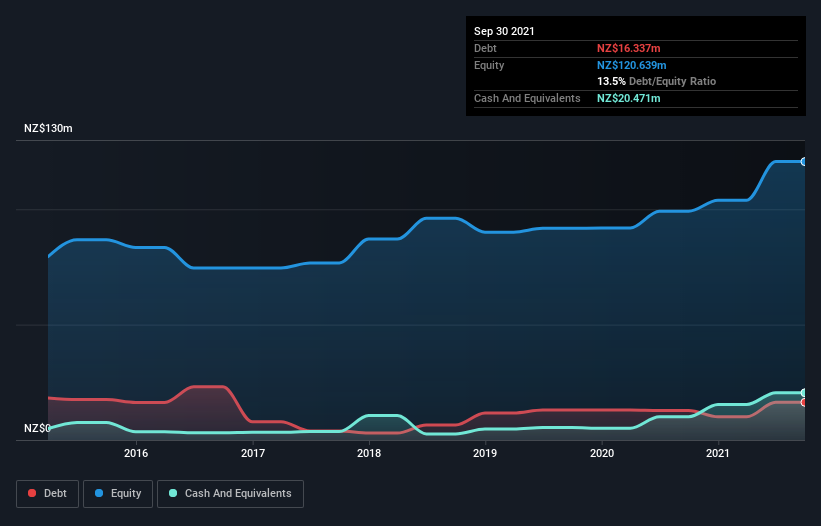
You can click the graphic below for the historical numbers, but it shows that as of September 2021 Rakon had NZ$16.3m of debt, an increase on NZ$12.8m, over one year. But on the other hand it also has NZ$20.5m in cash, leading to a NZ$4.13m net cash position.
How Strong Is Rakon's Balance Sheet?
The latest balance sheet data shows that Rakon had liabilities of NZ$32.6m due within a year, and liabilities of NZ$24.2m falling due after that. Offsetting this, it had NZ$20.5m in cash and NZ$51.7m in receivables that were due within 12 months. So it actually has NZ$15.4m more liquid assets than total liabilities.
This short term liquidity is a sign that Rakon could probably pay off its debt with ease, as its balance sheet is far from stretched. Succinctly put, Rakon boasts net cash, so it's fair to say it does not have a heavy debt load!
Better yet, Rakon grew its EBIT by 378% last year, which is an impressive improvement. That boost will make it even easier to pay down debt going forward. When analysing debt levels, the balance sheet is the obvious place to start. But ultimately the future profitability of the business will decide if Rakon can strengthen its balance sheet over time. So if you're focused on the future you can check out this free report showing analyst profit forecasts.
Finally, a company can only pay off debt with cold hard cash, not accounting profits. Rakon may have net cash on the balance sheet, but it is still interesting to look at how well the business converts its earnings before interest and tax (EBIT) to free cash flow, because that will influence both its need for, and its capacity to manage debt. In the last three years, Rakon's free cash flow amounted to 49% of its EBIT, less than we'd expect. That weak cash conversion makes it more difficult to handle indebtedness.
Summing up
While we empathize with investors who find debt concerning, you should keep in mind that Rakon has net cash of NZ$4.13m, as well as more liquid assets than liabilities. And we liked the look of last year's 378% year-on-year EBIT growth. So is Rakon's debt a risk? It doesn't seem so to us. There's no doubt that we learn most about debt from the balance sheet. But ultimately, every company can contain risks that exist outside of the balance sheet. For instance, we've identified 2 warning signs for Rakon (1 is a bit unpleasant) you should be aware of.
At the end of the day, it's often better to focus on companies that are free from net debt. You can access our special list of such companies (all with a track record of profit growth). It's free.
Have feedback on this article? Concerned about the content? Get in touch with us directly. Alternatively, email editorial-team (at) simplywallst.com.
This article by Simply Wall St is general in nature. We provide commentary based on historical data and analyst forecasts only using an unbiased methodology and our articles are not intended to be financial advice. It does not constitute a recommendation to buy or sell any stock, and does not take account of your objectives, or your financial situation. We aim to bring you long-term focused analysis driven by fundamental data. Note that our analysis may not factor in the latest price-sensitive company announcements or qualitative material. Simply Wall St has no position in any stocks mentioned.
