
 Yahoo Finance
 Read This Before You Buy Eurotech S.p.A. (BIT:ETH) Because Of Its P/E Ratio

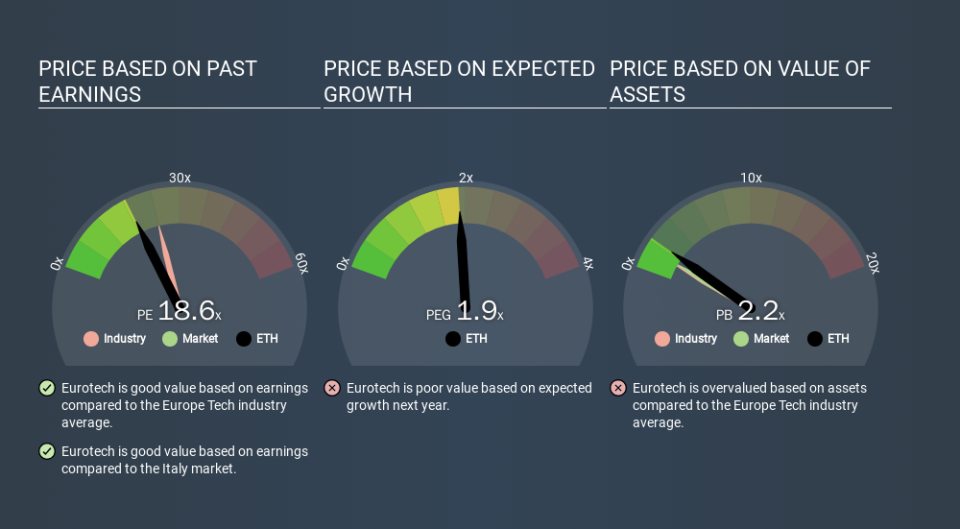
This article is written for those who want to get better at using price to earnings ratios (P/E ratios). To keep it practical, we'll show how Eurotech S.p.A.'s (BIT:ETH) P/E ratio could help you assess the value on offer. Based on the last twelve months, Eurotech's P/E ratio is 18.63. In other words, at today's prices, investors are paying €18.63 for every €1 in prior year profit.
Check out our latest analysis for Eurotech
How Do You Calculate A P/E Ratio?
The formula for P/E is:
Price to Earnings Ratio = Price per Share ÷ Earnings per Share (EPS)
Or for Eurotech:
P/E of 18.63 = EUR7.64 ÷ EUR0.41 (Based on the trailing twelve months to September 2019.)
Is A High Price-to-Earnings Ratio Good?
A higher P/E ratio means that buyers have to pay a higher price for each EUR1 the company has earned over the last year. That isn't necessarily good or bad, but a high P/E implies relatively high expectations of what a company can achieve in the future.
Does Eurotech Have A Relatively High Or Low P/E For Its Industry?
One good way to get a quick read on what market participants expect of a company is to look at its P/E ratio. The image below shows that Eurotech has a lower P/E than the average (24.4) P/E for companies in the tech industry.
Its relatively low P/E ratio indicates that Eurotech shareholders think it will struggle to do as well as other companies in its industry classification. Since the market seems unimpressed with Eurotech, it's quite possible it could surprise on the upside. If you consider the stock interesting, further research is recommended. For example, I often monitor director buying and selling.
How Growth Rates Impact P/E Ratios
Earnings growth rates have a big influence on P/E ratios. Earnings growth means that in the future the 'E' will be higher. That means unless the share price increases, the P/E will reduce in a few years. A lower P/E should indicate the stock is cheap relative to others -- and that may attract buyers.
In the last year, Eurotech grew EPS like Taylor Swift grew her fan base back in 2010; the 139% gain was both fast and well deserved.
A Limitation: P/E Ratios Ignore Debt and Cash In The Bank
Don't forget that the P/E ratio considers market capitalization. That means it doesn't take debt or cash into account. Hypothetically, a company could reduce its future P/E ratio by spending its cash (or taking on debt) to achieve higher earnings.
Such spending might be good or bad, overall, but the key point here is that you need to look at debt to understand the P/E ratio in context.
So What Does Eurotech's Balance Sheet Tell Us?
The extra options and safety that comes with Eurotech's €10m net cash position means that it deserves a higher P/E than it would if it had a lot of net debt.
The Verdict On Eurotech's P/E Ratio
Eurotech trades on a P/E ratio of 18.6, which is fairly close to the IT market average of 18.7. The excess cash it carries is the gravy on top its fast EPS growth. So at a glance we're a bit surprised that Eurotech does not have a higher P/E ratio. All the more so, since analysts expect further profit growth. Click here to research this potential opportunity..
When the market is wrong about a stock, it gives savvy investors an opportunity. As value investor Benjamin Graham famously said, 'In the short run, the market is a voting machine but in the long run, it is a weighing machine. So this free visual report on analyst forecasts could hold the key to an excellent investment decision.
Of course, you might find a fantastic investment by looking at a few good candidates. So take a peek at this free list of companies with modest (or no) debt, trading on a P/E below 20.
If you spot an error that warrants correction, please contact the editor at editorial-team@simplywallst.com. This article by Simply Wall St is general in nature. It does not constitute a recommendation to buy or sell any stock, and does not take account of your objectives, or your financial situation. Simply Wall St has no position in the stocks mentioned.
We aim to bring you long-term focused research analysis driven by fundamental data. Note that our analysis may not factor in the latest price-sensitive company announcements or qualitative material. Thank you for reading.
