
 Yahoo Finance
 Redfin Corporation's (NASDAQ:RDFN) Revenues Are Not Doing Enough For Some Investors
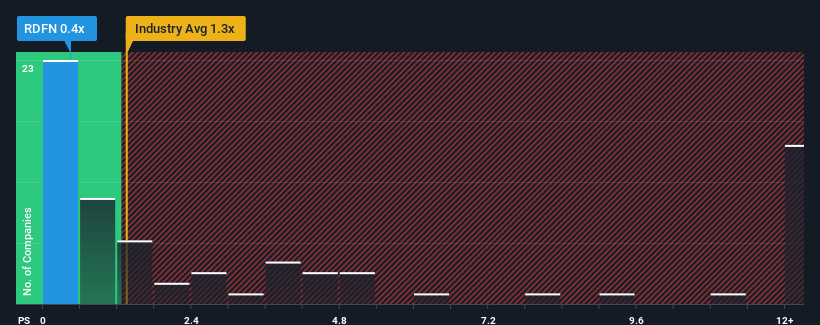
Redfin Corporation's (NASDAQ:RDFN) price-to-sales (or "P/S") ratio of 0.4x might make it look like a buy right now compared to the Real Estate industry in the United States, where around half of the companies have P/S ratios above 1.3x and even P/S above 6x are quite common. Although, it's not wise to just take the P/S at face value as there may be an explanation why it's limited.
Check out our latest analysis for Redfin
How Has Redfin Performed Recently?
Recent times have been advantageous for Redfin as its revenues have been rising faster than most other companies. Perhaps the market is expecting future revenue performance to dive, which has kept the P/S suppressed. If you like the company, you'd be hoping this isn't the case so that you could potentially pick up some stock while it's out of favour.
Want the full picture on analyst estimates for the company? Then our free report on Redfin will help you uncover what's on the horizon.
Is There Any Revenue Growth Forecasted For Redfin?
The only time you'd be truly comfortable seeing a P/S as low as Redfin's is when the company's growth is on track to lag the industry.
Taking a look back first, we see that the company grew revenue by an impressive 19% last year. Pleasingly, revenue has also lifted 193% in aggregate from three years ago, thanks to the last 12 months of growth. So we can start by confirming that the company has done a great job of growing revenue over that time.
Turning to the outlook, the next three years should bring diminished returns, with revenue decreasing 16% per annum as estimated by the analysts watching the company. That's not great when the rest of the industry is expected to grow by 7.5% per annum.
With this information, we are not surprised that Redfin is trading at a P/S lower than the industry. However, shrinking revenues are unlikely to lead to a stable P/S over the longer term. Even just maintaining these prices could be difficult to achieve as the weak outlook is weighing down the shares.
The Bottom Line On Redfin's P/S
Using the price-to-sales ratio alone to determine if you should sell your stock isn't sensible, however it can be a practical guide to the company's future prospects.
It's clear to see that Redfin maintains its low P/S on the weakness of its forecast for sliding revenue, as expected. At this stage investors feel the potential for an improvement in revenue isn't great enough to justify a higher P/S ratio. It's hard to see the share price rising strongly in the near future under these circumstances.
And what about other risks? Every company has them, and we've spotted 3 warning signs for Redfin you should know about.
If companies with solid past earnings growth is up your alley, you may wish to see this free collection of other companies with strong earnings growth and low P/E ratios.
Have feedback on this article? Concerned about the content? Get in touch with us directly. Alternatively, email editorial-team (at) simplywallst.com.
This article by Simply Wall St is general in nature. We provide commentary based on historical data and analyst forecasts only using an unbiased methodology and our articles are not intended to be financial advice. It does not constitute a recommendation to buy or sell any stock, and does not take account of your objectives, or your financial situation. We aim to bring you long-term focused analysis driven by fundamental data. Note that our analysis may not factor in the latest price-sensitive company announcements or qualitative material. Simply Wall St has no position in any stocks mentioned.
Join A Paid User Research Session
You’ll receive a US$30 Amazon Gift card for 1 hour of your time while helping us build better investing tools for the individual investors like yourself. Sign up here
