
 Yahoo Finance
 Reflecting on Kiwi Property Group's(NZSE:KPG) Total Shareholder Returns Over The Last Five Years
In order to justify the effort of selecting individual stocks, it's worth striving to beat the returns from a market index fund. But every investor is virtually certain to have both over-performing and under-performing stocks. So we wouldn't blame long term Kiwi Property Group Limited (NZSE:KPG) shareholders for doubting their decision to hold, with the stock down 25% over a half decade.
View our latest analysis for Kiwi Property Group
To paraphrase Benjamin Graham: Over the short term the market is a voting machine, but over the long term it's a weighing machine. By comparing earnings per share (EPS) and share price changes over time, we can get a feel for how investor attitudes to a company have morphed over time.
During five years of share price growth, Kiwi Property Group moved from a loss to profitability. That would generally be considered a positive, so we are surprised to see the share price is down. Other metrics might give us a better handle on how its value is changing over time.
In contrast to the share price, revenue has actually increased by 1.2% a year in the five year period. So it seems one might have to take closer look at the fundamentals to understand why the share price languishes. After all, there may be an opportunity.
The image below shows how earnings and revenue have tracked over time (if you click on the image you can see greater detail).
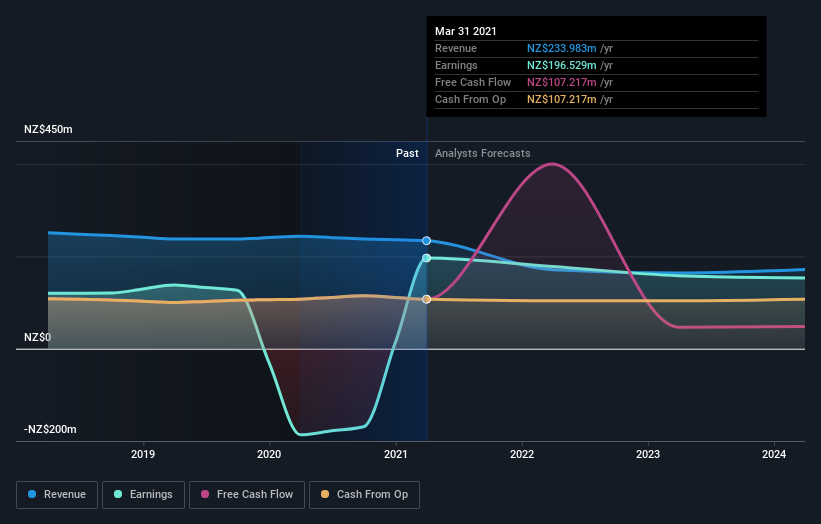
We know that Kiwi Property Group has improved its bottom line lately, but what does the future have in store? If you are thinking of buying or selling Kiwi Property Group stock, you should check out this free report showing analyst profit forecasts.
What about the Total Shareholder Return (TSR)?
Investors should note that there's a difference between Kiwi Property Group's total shareholder return (TSR) and its share price change, which we've covered above. The TSR is a return calculation that accounts for the value of cash dividends (assuming that any dividend received was reinvested) and the calculated value of any discounted capital raisings and spin-offs. Dividends have been really beneficial for Kiwi Property Group shareholders, and that cash payout explains why its total shareholder loss of 4.6%, over the last 5 years, isn't as bad as the share price return.
A Different Perspective
We're pleased to report that Kiwi Property Group shareholders have received a total shareholder return of 18% over one year. There's no doubt those recent returns are much better than the TSR loss of 0.9% per year over five years. This makes us a little wary, but the business might have turned around its fortunes. While it is well worth considering the different impacts that market conditions can have on the share price, there are other factors that are even more important. For instance, we've identified 4 warning signs for Kiwi Property Group (2 are potentially serious) that you should be aware of.
If you would prefer to check out another company -- one with potentially superior financials -- then do not miss this free list of companies that have proven they can grow earnings.
Please note, the market returns quoted in this article reflect the market weighted average returns of stocks that currently trade on NZ exchanges.
This article by Simply Wall St is general in nature. It does not constitute a recommendation to buy or sell any stock, and does not take account of your objectives, or your financial situation. We aim to bring you long-term focused analysis driven by fundamental data. Note that our analysis may not factor in the latest price-sensitive company announcements or qualitative material. Simply Wall St has no position in any stocks mentioned.
Have feedback on this article? Concerned about the content? Get in touch with us directly. Alternatively, email editorial-team (at) simplywallst.com.
