
 Yahoo Finance
 Regions Financial (RF) Up 7.2% Since Earnings Report: Can It Continue?

A month has gone by since the last earnings report for Regions Financial Corporation RF. Shares have added about 7.2% in the past month, outperforming the market.
Will the recent positive trend continue leading up to its next earnings release, or is RF due for a pullback? Before we dive into how investors and analysts have reacted as of late, let's take a quick look at its most recent earnings report in order to get a better handle on the important drivers.
Regions Financial's Q4 Earnings Beat on High Revenues
Driven by top-line strength, Regions Financial recorded an impressive earnings surprise of 3.8% in fourth-quarter 2017. Reported earnings of 27 cents per share outpaced the Zacks Consensus Estimate of 26 cents. Moreover, results compared favorably with the prior-year quarter’s earnings of 23 cents. Results included certain one-time items of 7 cents per share.
Income from continuing operations available to common shareholders was $318 million compared with $278 million recorded in the year-ago period.
Easing margin pressure and higher revenues were the positive factors. Moreover, credit quality recorded significant improvement. However, lower loans and deposits balance were the undermining factors. In addition, expenses escalated.
For 2017, income from continuing operations available to common shareholders was $1.19 billion compared with $1.09 billion in 2016. Earnings per share from continuing operations were $1.00, up from 87 cents in 2016. Results surpassed the Zacks Consensus Estimate by a penny.
Revenues Improve, Costs Flare Up
For 2017, adjusted total revenues (net of interest expense) came in at $5.71 billion, up 2.6% year over year. Further, the figure surpassed the Zacks Consensus Estimate of $5.69 billion.
Adjusted total revenues (net of interest expense) came in at $1.47 billion in the reported quarter, beating the Zacks Consensus Estimate of $1.45 billion. Additionally, revenues climbed 6.2% from the year-ago quarter figure.
Regions Financial reported adjusted pre-tax pre-provision income from continuing operations of $548 million, up 12.3% year over year.
On a fully-taxable equivalent (FTE) basis, net interest income was $930 million, up 6.4% year over year. Net interest margin (on an FTE basis) expanded 23 basis points (bps) year over year to 3.39% in the quarter. Elevated market interest rates and deposit cost management drove the results. These increases were partially offset by reduced average loan balances, the impact of debt issued during the third quarter and the tax-related reduction related to leveraged leases.
Non-interest income jumped 6.3% to come in at $555 million. Higher capital markets, wealth management, and card & ATM fees primarily led to the rise, partly offset by lower mortgage income.
Non-interest expense escalated 5.9% year over year to $952 million. On an adjusted basis, non-interest expenses flared up 2.7% year over year to $901 million, mainly due to elevated salaries and employee-benefit expenses, outside services costs and other expenses.
Balance Sheet Strength
As of Dec 31, 2017, total loans were slightly down year over year to $79.9 billion. Also, total deposits came in at $96.9 billion, down 2.2% year over year. Total funding costs came in at 38 bps.
As of Dec 31, 2017, low-cost deposits, as a percentage of average deposits, were 92.9% compared with 92.5% as of Dec 31, 2016. In addition, deposit costs came in at 17 bps in the reported quarter.
Credit Quality Improves
Non-performing assets, as a percentage of loans, foreclosed properties and non-performing loans held for sale, contracted 45 bps from the prior-year quarter to 0.92%. Also, non-accrual loans, excluding loans held for sale, as a percentage of loans, came in at 0.81%, shrunk 43 bps from the year-ago quarter.
Allowance for loan losses as a percentage of loans, net of unearned income was 1.17%, down 19 bps from the year-earlier quarter. The company’s total business services criticized loans plunged 32% year over year.
Additionally, provision for loan losses recorded credit of $44 million compared with the provision of $48 million reported in the prior-year quarter. In addition to this, net charge-offs as a percentage of average loans came in at 0.31%, contracting 10 bps.
Strong Capital Position
Regions Financial’s estimated ratios remained well above the regulatory requirements under the Basel III capital rules. As of Dec 31, 2017, Basel III Common Equity Tier 1 ratio (fully phased-in) and Tier 1 capital ratio were estimated at 10.8% and 11.7%, respectively, compared to 11.1% and 12% recorded in the year-earlier quarter.
During 2017, Regions Financial returned about $1.6 billion as capital to shareholders through dividend payments and common stock repurchases. Notably, during the fourth quarter, this bank repurchased 31.1 million shares of common stock for a total cost of $500 million and announced $103 million in dividends to common shareholders.
Outlook for 2018
For 2018, Regions Financial expects NII and other financing income growth in the range of 3-5%.
Adjusted non-interest income is estimated to grow 3-6% in 2018.
Regions Financial projects adjusted expenses to remain stable in 2018, while efficiency ratio is expected to scale below 60% in 2018. Adjusted operating leverage is projected to be 3-5%.
Management expects average loans in 2018 to grow in low single digits on a year-over-year basis. This excludes the impact of the third-party indirect-vehicle portfolio. Expected decline in average third-party indirect-vehicle is likely to be $700 million.
Average deposits are expected to grow in low single digits, excluding brokered and Wealth Institutional Services deposits.
Net charge-offs (NCOs) are estimated at 35-50 basis points for 2018. Based on the recent performance and current market conditions, management expects to be at the lower end of that range. Nevertheless, quarter-to-quarter volatility in certain credit metrics can be expected particularly associated with huge dollar commercial credits, variable commodity prices and outcome of further detailed hurricane-related exposures.
The effective tax rate is projected to be in the 20-22% range for 2018.
For 2018, following tax-reform changes, adjusted return on average tangible common equity ratio is expected to be in the 14-16% range.
How Have Estimates Been Moving Since Then?
In the past month, investors have witnessed an upward trend in fresh estimates. There have been 15 revisions higher for the current quarter, while looking back an additional 30 days, we can see even more upward momentum.
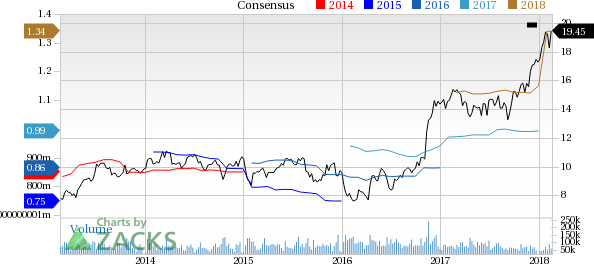
Regions Financial Corporation Price and Consensus
Regions Financial Corporation Price and Consensus | Regions Financial Corporation Quote
VGM Scores
At this time, RF has a subpar Growth Score of D, a grade with the same score on the momentum front. However, the stock was also allocated a grade of B on the value side, putting it in the top 40% for this investment strategy.
Overall, the stock has an aggregate VGM Score of D. If you aren't focused on one strategy, this score is the one you should be interested in.
The company's stock is suitable solely for value based on our styles scores.
Outlook
Estimates have been trending upward for the stock, and the magnitude of these revisions looks promising. It comes with little surprise RF has a Zacks Rank #2 (Buy). We expect an above average return from the stock in the next few months.
Want the latest recommendations from Zacks Investment Research? Today, you can download 7 Best Stocks for the Next 30 Days. Click to get this free report
Regions Financial Corporation (RF) : Free Stock Analysis Report
To read this article on Zacks.com click here.
Zacks Investment Research
