
 Yahoo Finance
 The Return Trends At L.S. Starrett (NYSE:SCX) Look Promising
What are the early trends we should look for to identify a stock that could multiply in value over the long term? Firstly, we'll want to see a proven return on capital employed (ROCE) that is increasing, and secondly, an expanding base of capital employed. Put simply, these types of businesses are compounding machines, meaning they are continually reinvesting their earnings at ever-higher rates of return. So on that note, L.S. Starrett (NYSE:SCX) looks quite promising in regards to its trends of return on capital.
Understanding Return On Capital Employed (ROCE)
If you haven't worked with ROCE before, it measures the 'return' (pre-tax profit) a company generates from capital employed in its business. Analysts use this formula to calculate it for L.S. Starrett:
Return on Capital Employed = Earnings Before Interest and Tax (EBIT) ÷ (Total Assets - Current Liabilities)
0.15 = US$22m ÷ (US$206m - US$59m) (Based on the trailing twelve months to March 2022).
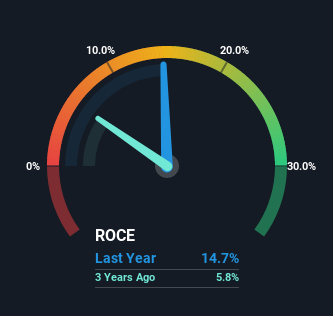
Therefore, L.S. Starrett has an ROCE of 15%. On its own, that's a standard return, however it's much better than the 9.5% generated by the Machinery industry.
View our latest analysis for L.S. Starrett
While the past is not representative of the future, it can be helpful to know how a company has performed historically, which is why we have this chart above. If you're interested in investigating L.S. Starrett's past further, check out this free graph of past earnings, revenue and cash flow.
How Are Returns Trending?
We're delighted to see that L.S. Starrett is reaping rewards from its investments and has now broken into profitability. While the business was unprofitable in the past, it's now turned things around and is earning 15% on its capital. While returns have increased, the amount of capital employed by L.S. Starrett has remained flat over the period. With no noticeable increase in capital employed, it's worth knowing what the company plans on doing going forward in regards to reinvesting and growing the business. Because in the end, a business can only get so efficient.
On a side note, we noticed that the improvement in ROCE appears to be partly fueled by an increase in current liabilities. The current liabilities has increased to 29% of total assets, so the business is now more funded by the likes of its suppliers or short-term creditors. It's worth keeping an eye on this because as the percentage of current liabilities to total assets increases, some aspects of risk also increase.
The Key Takeaway
To bring it all together, L.S. Starrett has done well to increase the returns it's generating from its capital employed. Investors may not be impressed by the favorable underlying trends yet because over the last five years the stock has only returned 2.5% to shareholders. So exploring more about this stock could uncover a good opportunity, if the valuation and other metrics stack up.
If you'd like to know more about L.S. Starrett, we've spotted 3 warning signs, and 1 of them is a bit unpleasant.
For those who like to invest in solid companies, check out this free list of companies with solid balance sheets and high returns on equity.
Have feedback on this article? Concerned about the content? Get in touch with us directly. Alternatively, email editorial-team (at) simplywallst.com.
This article by Simply Wall St is general in nature. We provide commentary based on historical data and analyst forecasts only using an unbiased methodology and our articles are not intended to be financial advice. It does not constitute a recommendation to buy or sell any stock, and does not take account of your objectives, or your financial situation. We aim to bring you long-term focused analysis driven by fundamental data. Note that our analysis may not factor in the latest price-sensitive company announcements or qualitative material. Simply Wall St has no position in any stocks mentioned.
Join A Paid User Research Session
You’ll receive a US$30 Amazon Gift card for 1 hour of your time while helping us build better investing tools for the individual investors like yourself. Sign up here
