
 Yahoo Finance
 The Return Trends At Liquidity Services (NASDAQ:LQDT) Look Promising
If you're looking for a multi-bagger, there's a few things to keep an eye out for. Firstly, we'd want to identify a growing return on capital employed (ROCE) and then alongside that, an ever-increasing base of capital employed. If you see this, it typically means it's a company with a great business model and plenty of profitable reinvestment opportunities. So on that note, Liquidity Services (NASDAQ:LQDT) looks quite promising in regards to its trends of return on capital.
Understanding Return On Capital Employed (ROCE)
If you haven't worked with ROCE before, it measures the 'return' (pre-tax profit) a company generates from capital employed in its business. To calculate this metric for Liquidity Services, this is the formula:
Return on Capital Employed = Earnings Before Interest and Tax (EBIT) ÷ (Total Assets - Current Liabilities)
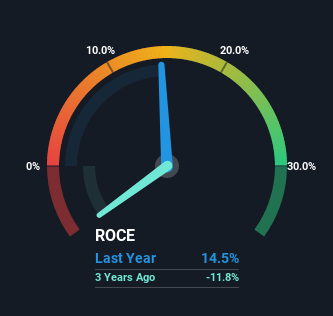
0.14 = US$24m ÷ (US$288m - US$124m) (Based on the trailing twelve months to September 2022).
Thus, Liquidity Services has an ROCE of 14%. In absolute terms, that's a satisfactory return, but compared to the Online Retail industry average of 12% it's much better.
View our latest analysis for Liquidity Services
In the above chart we have measured Liquidity Services' prior ROCE against its prior performance, but the future is arguably more important. If you'd like to see what analysts are forecasting going forward, you should check out our free report for Liquidity Services.
What Can We Tell From Liquidity Services' ROCE Trend?
Liquidity Services has broken into the black (profitability) and we're sure it's a sight for sore eyes. While the business was unprofitable in the past, it's now turned things around and is earning 14% on its capital. While returns have increased, the amount of capital employed by Liquidity Services has remained flat over the period. So while we're happy that the business is more efficient, just keep in mind that could mean that going forward the business is lacking areas to invest internally for growth. After all, a company can only become a long term multi-bagger if it continually reinvests in itself at high rates of return.
On a separate but related note, it's important to know that Liquidity Services has a current liabilities to total assets ratio of 43%, which we'd consider pretty high. This can bring about some risks because the company is basically operating with a rather large reliance on its suppliers or other sorts of short-term creditors. While it's not necessarily a bad thing, it can be beneficial if this ratio is lower.
The Bottom Line On Liquidity Services' ROCE
To sum it up, Liquidity Services is collecting higher returns from the same amount of capital, and that's impressive. And a remarkable 179% total return over the last five years tells us that investors are expecting more good things to come in the future. With that being said, we still think the promising fundamentals mean the company deserves some further due diligence.
Since virtually every company faces some risks, it's worth knowing what they are, and we've spotted 3 warning signs for Liquidity Services (of which 1 is a bit concerning!) that you should know about.
While Liquidity Services isn't earning the highest return, check out this free list of companies that are earning high returns on equity with solid balance sheets.
Have feedback on this article? Concerned about the content? Get in touch with us directly. Alternatively, email editorial-team (at) simplywallst.com.
This article by Simply Wall St is general in nature. We provide commentary based on historical data and analyst forecasts only using an unbiased methodology and our articles are not intended to be financial advice. It does not constitute a recommendation to buy or sell any stock, and does not take account of your objectives, or your financial situation. We aim to bring you long-term focused analysis driven by fundamental data. Note that our analysis may not factor in the latest price-sensitive company announcements or qualitative material. Simply Wall St has no position in any stocks mentioned.
Join A Paid User Research Session
You’ll receive a US$30 Amazon Gift card for 1 hour of your time while helping us build better investing tools for the individual investors like yourself. Sign up here
