
 Yahoo Finance
 Returns At California Resources (NYSE:CRC) Are On The Way Up
What are the early trends we should look for to identify a stock that could multiply in value over the long term? Amongst other things, we'll want to see two things; firstly, a growing return on capital employed (ROCE) and secondly, an expansion in the company's amount of capital employed. If you see this, it typically means it's a company with a great business model and plenty of profitable reinvestment opportunities. So on that note, California Resources (NYSE:CRC) looks quite promising in regards to its trends of return on capital.
Return On Capital Employed (ROCE): What Is It?
For those that aren't sure what ROCE is, it measures the amount of pre-tax profits a company can generate from the capital employed in its business. Analysts use this formula to calculate it for California Resources:
Return on Capital Employed = Earnings Before Interest and Tax (EBIT) ÷ (Total Assets - Current Liabilities)
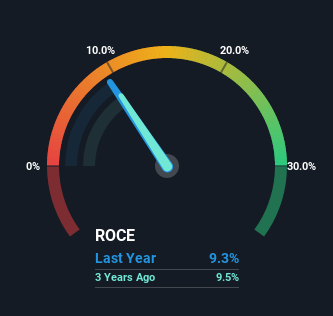
0.093 = US$284m ÷ (US$4.0b - US$932m) (Based on the trailing twelve months to September 2022).
So, California Resources has an ROCE of 9.3%. Ultimately, that's a low return and it under-performs the Oil and Gas industry average of 21%.
View our latest analysis for California Resources
Above you can see how the current ROCE for California Resources compares to its prior returns on capital, but there's only so much you can tell from the past. If you'd like, you can check out the forecasts from the analysts covering California Resources here for free.
How Are Returns Trending?
You'd find it hard not to be impressed with the ROCE trend at California Resources. We found that the returns on capital employed over the last five years have risen by 495%. That's a very favorable trend because this means that the company is earning more per dollar of capital that's being employed. Speaking of capital employed, the company is actually utilizing 44% less than it was five years ago, which can be indicative of a business that's improving its efficiency. A business that's shrinking its asset base like this isn't usually typical of a soon to be multi-bagger company.
On a side note, we noticed that the improvement in ROCE appears to be partly fueled by an increase in current liabilities. Essentially the business now has suppliers or short-term creditors funding about 23% of its operations, which isn't ideal. It's worth keeping an eye on this because as the percentage of current liabilities to total assets increases, some aspects of risk also increase.
In Conclusion...
From what we've seen above, California Resources has managed to increase it's returns on capital all the while reducing it's capital base. Since the stock has only returned 5.3% to shareholders over the last year, the promising fundamentals may not be recognized yet by investors. So with that in mind, we think the stock deserves further research.
If you'd like to know more about California Resources, we've spotted 4 warning signs, and 2 of them are potentially serious.
While California Resources isn't earning the highest return, check out this free list of companies that are earning high returns on equity with solid balance sheets.
Have feedback on this article? Concerned about the content? Get in touch with us directly. Alternatively, email editorial-team (at) simplywallst.com.
This article by Simply Wall St is general in nature. We provide commentary based on historical data and analyst forecasts only using an unbiased methodology and our articles are not intended to be financial advice. It does not constitute a recommendation to buy or sell any stock, and does not take account of your objectives, or your financial situation. We aim to bring you long-term focused analysis driven by fundamental data. Note that our analysis may not factor in the latest price-sensitive company announcements or qualitative material. Simply Wall St has no position in any stocks mentioned.
Join A Paid User Research Session
You’ll receive a US$30 Amazon Gift card for 1 hour of your time while helping us build better investing tools for the individual investors like yourself. Sign up here
