
 Yahoo Finance
 The Returns On Capital At CI Resources (ASX:CII) Don't Inspire Confidence
If we're looking to avoid a business that is in decline, what are the trends that can warn us ahead of time? More often than not, we'll see a declining return on capital employed (ROCE) and a declining amount of capital employed. This indicates to us that the business is not only shrinking the size of its net assets, but its returns are falling as well. So after glancing at the trends within CI Resources (ASX:CII), we weren't too hopeful.
What Is Return On Capital Employed (ROCE)?
For those who don't know, ROCE is a measure of a company's yearly pre-tax profit (its return), relative to the capital employed in the business. To calculate this metric for CI Resources, this is the formula:
Return on Capital Employed = Earnings Before Interest and Tax (EBIT) ÷ (Total Assets - Current Liabilities)
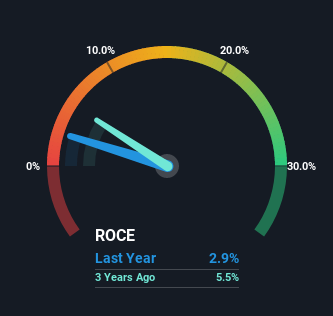
0.029 = AU$7.0m ÷ (AU$401m - AU$155m) (Based on the trailing twelve months to June 2022).
Thus, CI Resources has an ROCE of 2.9%. Ultimately, that's a low return and it under-performs the Metals and Mining industry average of 10.0%.
View our latest analysis for CI Resources
While the past is not representative of the future, it can be helpful to know how a company has performed historically, which is why we have this chart above. If you're interested in investigating CI Resources' past further, check out this free graph of past earnings, revenue and cash flow.
How Are Returns Trending?
We are a bit worried about the trend of returns on capital at CI Resources. About five years ago, returns on capital were 13%, however they're now substantially lower than that as we saw above. On top of that, it's worth noting that the amount of capital employed within the business has remained relatively steady. Since returns are falling and the business has the same amount of assets employed, this can suggest it's a mature business that hasn't had much growth in the last five years. So because these trends aren't typically conducive to creating a multi-bagger, we wouldn't hold our breath on CI Resources becoming one if things continue as they have.
On a side note, CI Resources' current liabilities have increased over the last five years to 39% of total assets, effectively distorting the ROCE to some degree. If current liabilities hadn't increased as much as they did, the ROCE could actually be even lower. While the ratio isn't currently too high, it's worth keeping an eye on this because if it gets particularly high, the business could then face some new elements of risk.
Our Take On CI Resources' ROCE
In summary, it's unfortunate that CI Resources is generating lower returns from the same amount of capital. It should come as no surprise then that the stock has fallen 18% over the last five years, so it looks like investors are recognizing these changes. That being the case, unless the underlying trends revert to a more positive trajectory, we'd consider looking elsewhere.
Since virtually every company faces some risks, it's worth knowing what they are, and we've spotted 4 warning signs for CI Resources (of which 3 are a bit unpleasant!) that you should know about.
While CI Resources may not currently earn the highest returns, we've compiled a list of companies that currently earn more than 25% return on equity. Check out this free list here.
Have feedback on this article? Concerned about the content? Get in touch with us directly. Alternatively, email editorial-team (at) simplywallst.com.
This article by Simply Wall St is general in nature. We provide commentary based on historical data and analyst forecasts only using an unbiased methodology and our articles are not intended to be financial advice. It does not constitute a recommendation to buy or sell any stock, and does not take account of your objectives, or your financial situation. We aim to bring you long-term focused analysis driven by fundamental data. Note that our analysis may not factor in the latest price-sensitive company announcements or qualitative material. Simply Wall St has no position in any stocks mentioned.
Join A Paid User Research Session
You’ll receive a US$30 Amazon Gift card for 1 hour of your time while helping us build better investing tools for the individual investors like yourself. Sign up here
