
 Yahoo Finance
 Returns On Capital Are Showing Encouraging Signs At New Zealand Oil & Gas (NZSE:NZO)
What trends should we look for it we want to identify stocks that can multiply in value over the long term? Amongst other things, we'll want to see two things; firstly, a growing return on capital employed (ROCE) and secondly, an expansion in the company's amount of capital employed. Put simply, these types of businesses are compounding machines, meaning they are continually reinvesting their earnings at ever-higher rates of return. So on that note, New Zealand Oil & Gas (NZSE:NZO) looks quite promising in regards to its trends of return on capital.
Return On Capital Employed (ROCE): What Is It?
If you haven't worked with ROCE before, it measures the 'return' (pre-tax profit) a company generates from capital employed in its business. To calculate this metric for New Zealand Oil & Gas, this is the formula:
Return on Capital Employed = Earnings Before Interest and Tax (EBIT) ÷ (Total Assets - Current Liabilities)
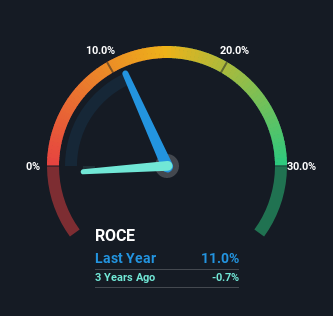
0.11 = NZ$26m ÷ (NZ$282m - NZ$48m) (Based on the trailing twelve months to June 2022).
So, New Zealand Oil & Gas has an ROCE of 11%. By itself that's a normal return on capital and it's in line with the industry's average returns of 11%.
See our latest analysis for New Zealand Oil & Gas
While the past is not representative of the future, it can be helpful to know how a company has performed historically, which is why we have this chart above. If you want to delve into the historical earnings, revenue and cash flow of New Zealand Oil & Gas, check out these free graphs here.
What Does the ROCE Trend For New Zealand Oil & Gas Tell Us?
The fact that New Zealand Oil & Gas is now generating some pre-tax profits from its prior investments is very encouraging. About five years ago the company was generating losses but things have turned around because it's now earning 11% on its capital. In addition to that, New Zealand Oil & Gas is employing 44% more capital than previously which is expected of a company that's trying to break into profitability. This can indicate that there's plenty of opportunities to invest capital internally and at ever higher rates, both common traits of a multi-bagger.
For the record though, there was a noticeable increase in the company's current liabilities over the period, so we would attribute some of the ROCE growth to that. Essentially the business now has suppliers or short-term creditors funding about 17% of its operations, which isn't ideal. It's worth keeping an eye on this because as the percentage of current liabilities to total assets increases, some aspects of risk also increase.
The Bottom Line
In summary, it's great to see that New Zealand Oil & Gas has managed to break into profitability and is continuing to reinvest in its business. Given the stock has declined 29% in the last five years, this could be a good investment if the valuation and other metrics are also appealing. So researching this company further and determining whether or not these trends will continue seems justified.
Since virtually every company faces some risks, it's worth knowing what they are, and we've spotted 3 warning signs for New Zealand Oil & Gas (of which 1 can't be ignored!) that you should know about.
While New Zealand Oil & Gas isn't earning the highest return, check out this free list of companies that are earning high returns on equity with solid balance sheets.
Have feedback on this article? Concerned about the content? Get in touch with us directly. Alternatively, email editorial-team (at) simplywallst.com.
This article by Simply Wall St is general in nature. We provide commentary based on historical data and analyst forecasts only using an unbiased methodology and our articles are not intended to be financial advice. It does not constitute a recommendation to buy or sell any stock, and does not take account of your objectives, or your financial situation. We aim to bring you long-term focused analysis driven by fundamental data. Note that our analysis may not factor in the latest price-sensitive company announcements or qualitative material. Simply Wall St has no position in any stocks mentioned.
Join A Paid User Research Session
You’ll receive a US$30 Amazon Gift card for 1 hour of your time while helping us build better investing tools for the individual investors like yourself. Sign up here
